
 Subscribe to newsletter

10/08/2020
The Australian Council of Superannuation Investors (ACSI) has released its most recent survey of CEO remuneration based on FY19 disclosures. Results of a similar annual survey were published by Guerdon Associates in February, (see HERE).
As with past years, the ACSI report was interesting, and worth reviewing. The main points arising from this year’s ACSI survey are that:
- Fewer CEOs received an annual incentive;
- The annual incentive received as a proportion of the maximum declined to its lowest level over a 5 year period;
- CEO “realised” pay varies with returns to shareholders; and
- The inference that pay received by an ex-CEO after stepping down to a non-KMP executive position is termination pay.
Not noted by the survey is that average CEO pay continues to lag general employee average weekly total earnings and CPI.
Below is a summary of the findings.
Fixed Remuneration
Consistent with recent years, ASX100 CEO fixed pay remains relatively flat. Average fixed pay rose modestly by 0.4% year on year. This can be compared to an increase of 3.3% year on year in average weekly total earnings, calculated by Guerdon Associates using Australian Bureau of Statistics figures.
Median ASX100 CEO fixed pay decreased 1.3% year on year, continuing a trend of modest flat or decline in median fixed pay since FY2012.
While ACSI noted CPI rose 14.3% between June 2012 and June 2019, they did not provide the percentage change in ASX 100 CEO median fixed pay over this same period. Based on ACSI’s numbers, we calculated this as -9.6%.
The decline has been attributed by ACSI to the replacement of CEOs with lower-paid successors. As CEO turnover rates and replacement by internal appointments have not materially changed in 20 years, and internal appointments pre-2012 were on a lower pay as well, we suspect this does not fully explain the difference. Statistically this reason alone is unlikely to explain the drop in median. Rather, the rate of increase to same incumbents (with an increase in same incumbent median measured by ACSI at 9.2%) is lower than the period to 2012, which does not make up for the lower pay to successors. So, while the former no longer makes up for the latter, it is the former (the rate of same incumbent increase) that probably explains the change since 2012.
The ASX 101-200 CEO fixed pay increased modestly. Average and median fixed pay increased 2.2% and 0.6% year on year, respectively. Over a nine-year period, the ASX 101-200 CEO median fixed pay increased 16.3%, consistent with the inflation increase of 15.7% over the same period. Guerdon Associates also compared the median fixed pay increase of 16.3% to the weekly total earnings increases over the same period, which was 23.9%.
ACSI suggests the contrast between ASX 100 and ASX 101-200 fixed pay is a result of increased scrutiny of CEO pay for larger companies. While this may be the case, there is not any evidence for this, and other factors could be at work. For example, the EPS change of the ASX 100 median company from 2011 to 2019 was 59%, compared to the EPS change of 85% for the ASX101-200 median company. In contrast, the market cap change of the ASX 100 median company from 2011 to 2019 was 107% compared to the 75% for the ASX101-200 median company.
Guerdon Associates will undertake some more analytical work on this for our February review of 2020 CEO remuneration to consider more fully the statistical drivers of CEO pay.
“Realised” pay
ACSI’s definition of “realised pay” would best be described as a composite of realised pay and realisable pay. The former is the outcome from when an executive decides to exercise an option. This could be years after vesting. Realisable pay is the market value of a share on the day the share or share right vested. ACSI uses realised value for options, and realisable value for share rights (ZEPOs). See a review of pros and cons associated with these measures and their utility HERE.
Despite these methodological questions, the ACSI analysis supports the hypothesis that executive pay is variable with market value and investor returns.
Average “realised” pay for ASX100 CEOs continued to fall in FY19 to $5.24m from the prior $5.66m. Median realised pay fell to $4.13m from $4.5m. ACSI notes the ASX 100 median and average “realised“ pay over the past six years have fluctuated over a relatively narrow range.
The average realised pay remains significantly above the median realised pay and this has been the case for all years this study has been conducted. This is to be expected as incentives are intended to reward CEO and company performance – there will be winners and losers, such that some CEOs who perform and whose company’s share price increases will have substantially larger “realised” pay amounts than others. If the grant was above benchmark to begin with, the sizable nature of the reward is compounded by performance.
The median realised pay for ASX 101-200 companies increased 25% to $2.17 million, while the average increased 43% to $3.63m.
Reported pay
Both median and average reported pay reduced for ASX 100 CEOs. Median fell from $4.57m to $4.53m and average fell from $5.12m to $5.08m.
Median reported pay for ASX 101-200 CEOs decreased from $2.03m to $1.90m. The average also decreased from $2.32m to $2.18m.
ACSI reported relatively high levels of correlation between reported and “realised” pay again in FY2019 for the ASX 200 sample. For example, of the top 10 reported-pay ASX101-200 CEOs, three were included in the top 10 realised pay with another three were included in the top 20.
Short term Incentives
ACSI labels STIs as bonuses. Technically, a bonus is a payment for an ex-post assessment of performance not subject to pre-defined performance objectives.
The report has again focused this year on the low number of CEOs who were eligible for an annual incentive and did not receive it. Of the 156 CEOs in the sample, 146 were eligible for a short-term incentive and 25 did not receive one, up from 7 who did not receive one in FY2018. In the ASX 100, twelve CEOs who were eligible for a short-term incentive did not receive one, up from just one in FY2018. The percentage of CEOs receiving no annual incentive in FY2019, 14.5%, was at the highest level since FY2016.
ACSI reported annual incentives awarded as a proportion of maximum over the past five years. The ASX 100 average ranged from 56% to 69% and median ranged from 60% to 70%. The FY2019 ASX 100 average and median were 56% and 60%, respectively, displaying the lowest average and median annual incentive awarded over the five-year period.
The ASX 101-200 average annual incentive awarded as a proportion of maximum ranged from 50% to 68% whilst median ranged from 58% to 76% for the past five years.
Most CEOs in the ASX 100 and ASX 101-200 received between 50.1% to 90% of their maximum annual incentive in FY2019.
Ten ASX200 CEOs received maximum annual incentive outcomes in FY2019, up from five in FY2018.
The median ASX 100 cash annual incentive modestly increased from $0.93m to $0.94m. The average decreased from $1.08m to $1.05m. The median awarded annual incentive (which includes equity) increased from $1.61m to $1.65m and the average declined from $2m to $1.87m.
ACSI noted the long-term decline in ASX 100 CEO cash annual incentive as a result of more common practice in deferring a portion of annual incentive into deferred equity.
The ASX 101-200 median cash annual incentive increased from $0.38m to $0.40m and the average increased from $0.48m to $0.50m. The median awarded annual incentive increased from $0.42m to $0.45m and the average reduced from $0.58m to $0.56m.
This median cash annual incentive was the highest in the ACSI nine-year study.
Termination Payments
ACSI noted of the fourteen termination payments to CEOs in FY2019, 6 exceeded $1 million. Five of those were in the ASX 100. Overall, termination payments decreased from $26.08m in FY2018 to $18.35m in FY2019.
An interesting development in ACSI’s thinking is the inference that the remuneration received by a CEO after stepping down as a KMP executive but being retained as a non-KMP executive is a termination payment. This is puzzling, as there are usually strong commercial reasons for a board to consider retaining the CEO’s services for a limited time as they transition to a new CEO. Therefore, we expect that most, if not all, of the few instances of this cannot be considered termination payments, as inferred by ACSI. While ACSI makes the point that there is no disclosure requirements after a KMP executive steps down, companies could consider further voluntary disclosure.
Same incumbent pay
One thing to note about the ACSI report is that it focuses on a full population of CEOs, as long as the company they are leading was in the ASX 100 or ASX 101-200 in the current year (83 CEOs for the ASX 100 and 73 for ASX 101-200 companies). That is, the data includes freshly minted CEOs along with those who have been in the role for a long time.
This captures the state of the market, and the percentage change of the state of the market year on year. However, it is not an indication of how much the remuneration of an individual CEO who has remained in their position has increased. That would be reflected by same incumbent data (66 ASX 100 CEOs and 52 ASX 101-200 CEOs).
The data movement on a same incumbent basis is as follows:
Table 1: ASX200 2-year CEO same incumbent data
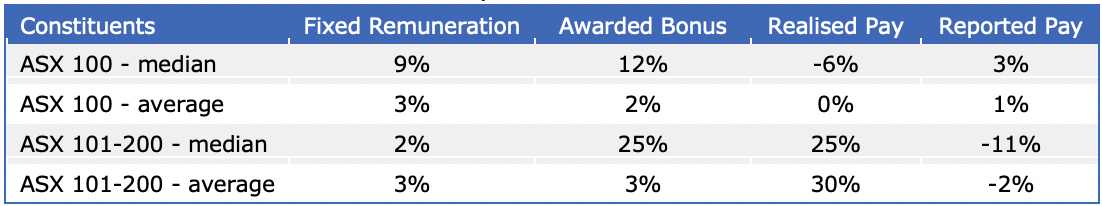
Realised pay increased substantially in the ASX 101-200. Fixed remuneration and STI awarded increased across the ASX 200. Reported pay increased for the ASX 100 and decreased for the ASX 101-200.
The full ACSI report can be found HERE.
© Guerdon Associates 2024
 Back to all articles


