
 Subscribe to newsletter

08/03/2021
Last year we published research breaking down STI award outcomes as a percentage of target and maximum, differentiated by sector (see HERE). We also published research last year on the extent that STI outcomes matched target performance (see HERE).
This month we will put our focus on breaking down STI award outcomes by company size using the following broad indices:
- ASX 20
- ASX 21-50
- ASX 51-100
- ASX 101-200
The analysis is based on ASX 200 STI outcomes in FY2018 and FY2019, i.e. it excludes FY2020 outcomes that were adversely impacted by COVID-19 for many organisations.
The chart below displays the STI outcome as a percentage of target STI by company size.
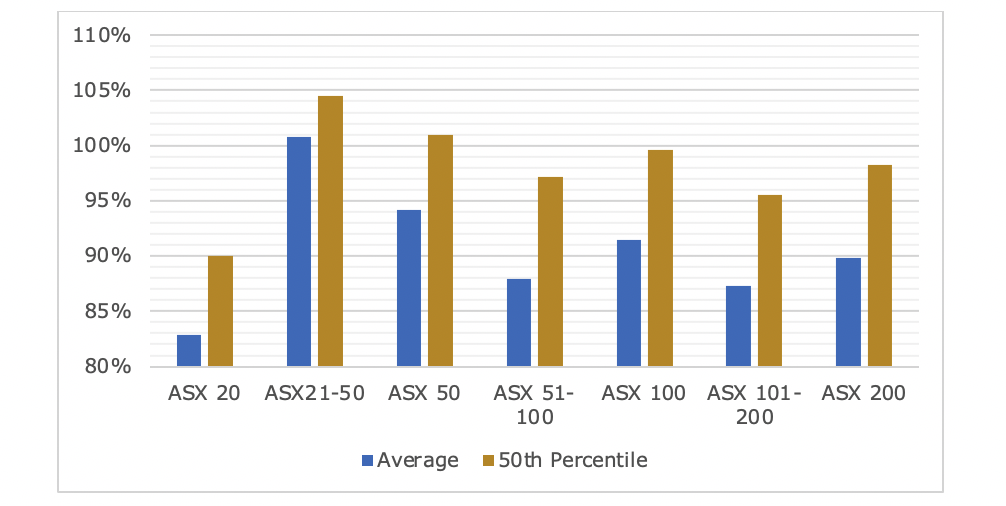
Figure 1: STI award outcomes as % of target
The graph is interesting in that it belies the assumption by many in the investment community and media that “all executives receive annual incentives for above average performance”. Based on data, the Lake Woebegone assertion is not valid.
At first glance, some may believe that size is a determinant of how well the STI opportunity pays out. The highest STI award outcomes as percentage of target were within the ASX 21-50 group. The lowest outcomes were in the ASX 20, which can be partly attributed to the royal commission into misconduct in the financial services industry. As financial services make up a large proportion of the ASX 20, the forfeitures of incentive pay for these executives as a result of the royal commission would push the average and median FY2018-19 outcomes downwards.
Interestingly, the median company in each size group achieved at least 90% of target STI which appears to demonstrate robust target setting processes across the ASX 200. If so, it also lends support to the view that board remuneration committees are doing their jobs well. This is further illustrated in figure 2 below.
Figure 2 below looks at the outcome of the STI awards as a percentage of maximum.
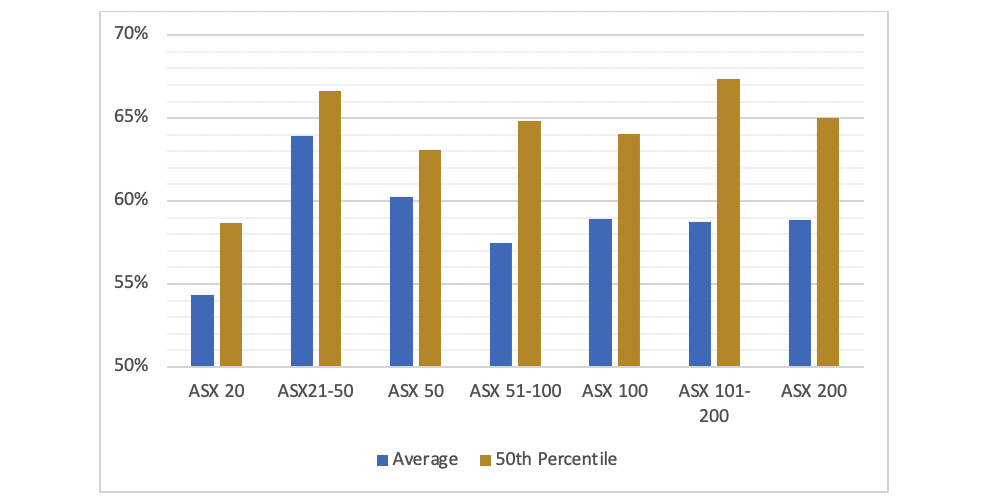
Figure 2: STI award outcomes as % of maximum
The highest average STI award outcome as a percentage of maximum STI was in the ASX 21-50 group, and the highest median outcome was within the ASX 101-200 group. Similar to the STI outcomes as a percentage of target, the lowest average and median outcomes as a percentage of maximum were in the ASX 20.
It is worth noting that the total number of data points for maximum STI in the sample is higher than for target STI, as not all ASX 200 companies disclose target STI policy details. The total number of observations for maximum STI in the analysed period FY2018-19 was 345, compared to 238 observations for target STI.
So, is company size a determinant of how well an STI pays out? The following charts plot the STI award outcome as a percentage of target and maximum against market capitalisation. The market capitalisation is the 1-year average market capitalisation to the respective financial year end. The natural log of market capitalisation was used due to positive skew resulting from outliers in a few very large companies.
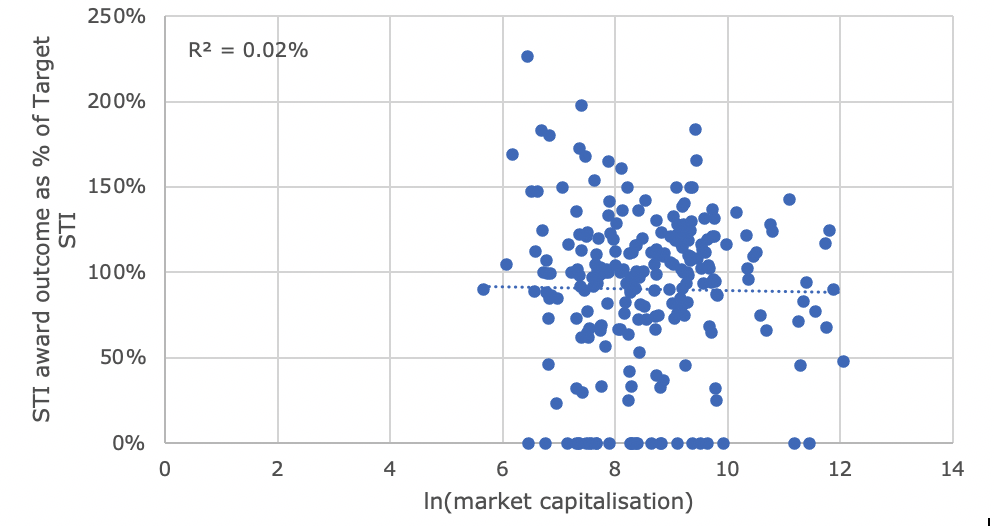
Figure 3: STI award as a % of target compared to market capitalisation
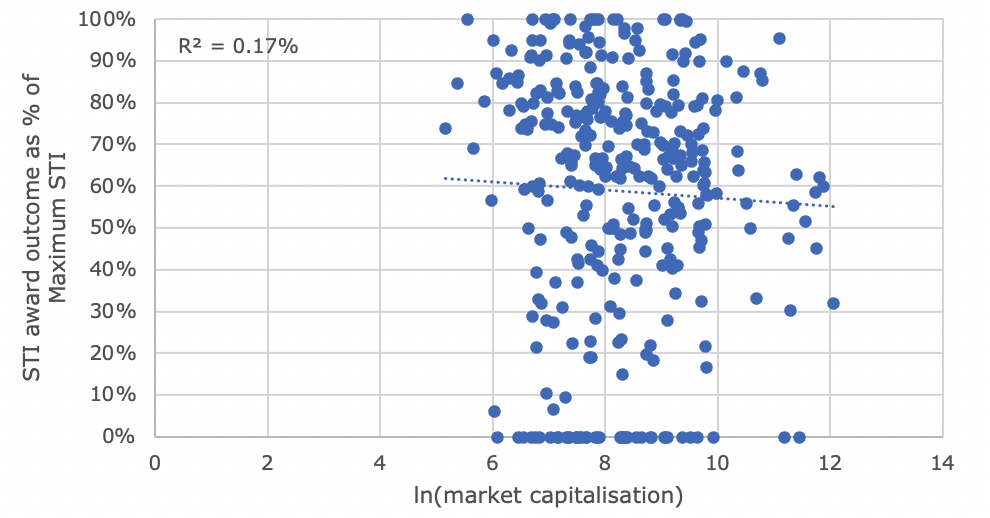
Figure 4: STI award as a % of maximum compared to market capitalisation
As shown by these figures there is no relationship between market capitalisation and STI award outcomes at either target or maximum (which was also confirmed by significance testing).
In other words: it is not the size of the company that determines the probability of STIs paying out. Rather, as shown in our last article (see HERE), tailwinds or headwinds for certain sectors tend to play a bigger role.
© Guerdon Associates 2024 Back to all articles


