
 Subscribe to newsletter

11/07/2016
Independent non-executive directors who, in sum, have diverse knowledge and experience to challenge, assist and balance the CEO are necessary for good governance. So, a rough rule of thumb to test whether the governance is as it should be has been to check that the sum of NED fees is at least the same, or greater, than CEO fixed remuneration. This waxes and wanes with the decades (for those of us in this business with long enough memories). Prior to the GFC is was getting a bit out of kilter, as CEO pay raced ahead and NED fees marked time. Now we are seeing the trend reversing, although we are not quite there yet.
The trend is being helped along by several factors. The better appreciation of, and need for, board diversity, coupled with generational change, has required NED fees to adjust for attracting younger NEDs. This pressure on fees has been compounded by the significant increase in workloads across boards, especially by board and committee chairmen, stemming from regulatory imposts and technology challenges. In addition, CEO fixed remuneration has declined, or stood still (depending on company size) as CEO turnover has increased, with replacements sourced internally on lower pay.
In 2015 we researched how reliably total NED fees could be predicted using CEO fixed pay (see HERE). We established that there was a strong relationship between the two, but that the relationship varied with company size and CEO tenure. We also established a strong shift from 2012 to 2014 for higher NED fees and lower CEO pay, relative over the two year period.
We have now updated the research and can confirm the continuing trend towards higher NED fees as a percentage of CEO fixed pay.
Methodology
We analysed the total fees paid to S&P/ASX 200 NEDs based on 2015 disclosures and compared these to the fixed pay of the company CEO. Termination payments were excluded and one-off awards, such as sign-on payments, were excluded.
Companies were excluded from the analysis if they:
- Had an executive chairman
- Had joint CEOs
- Do not pay any fees to the chairman
- Did not disclose both NED and CEO pay in 2015 and 2014, e.g. recent IPO companies
Our analysis is based on the remaining 148 companies from the current S&P/ASX 200.
Relationship to company size
Table 1 below shows statistics relating to the sample analysed. Market capitalisation represents the average value over calendar 2015. The percentile for each measure is independent of the others, so that the 50th percentile CEO pay company is not necessarily the same company with the 50th percentile NED fees. CEO fixed pay and total NED fees are strongly related, with a correlation coefficient of 0.7.
Table 1: CEO fixed pay and Non-executive director fees
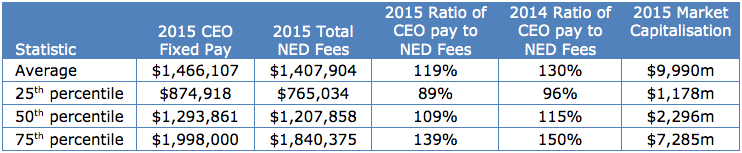
Figure 1 shows the actual 2015 CEO fixed pay and NED fees, plotted against a logarithmic market capitalisation scale.
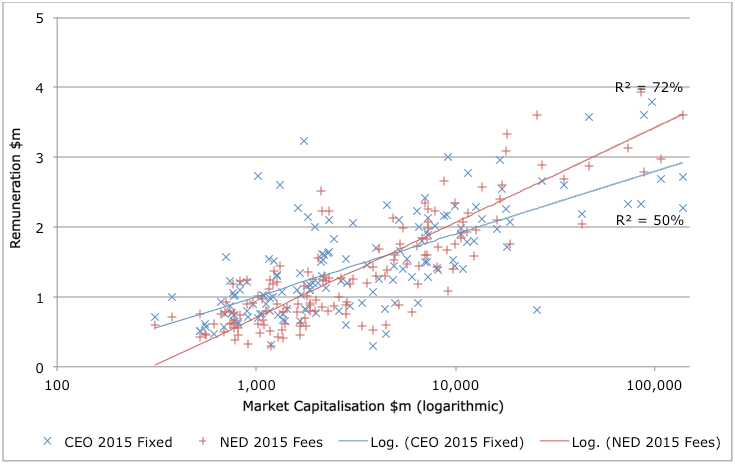
Figure 1: ASX 200 CEO fixed pay and NED fees plotted against market capitalisation
The graph shows that, on average, CEO fixed pay (in blue) exceeds total NED fees (in red) for companies with market capitalisation up to $4.5bn ($10bn in 2014) and drops below NED fees for larger companies. This is consistent with established pay and company size trends whereby larger companies generally structure pay with proportionately lower fixed pay and higher incentives.
Relationship with CEO tenure
We have previously noted the trend within larger companies to award significantly lower fixed pay to new incumbent CEOs, relative to their predecessors (see HERE). The trend is also evident in this analysis. Figure 2 shows the relationship between tenure and CEO pay as a percentage of total NED fees in 2015 for ASX 20 companies. The R squared statistic for the relationship is 38%.
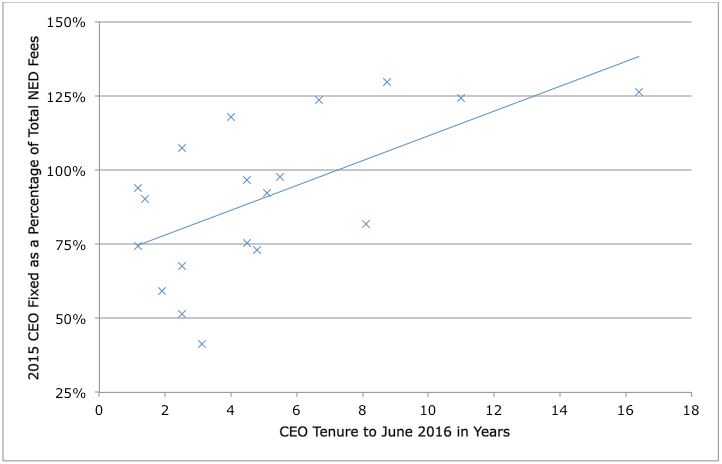
Figure 2: ASX 20 CEO fixed pay as a percentage of NED fees plotted against tenure
Changes since 2014 and by sector
ASX 20 results for 2015 were compared with results based on equivalent 2014 disclosures. Overall the average CEO fixed pay as a percentage of total NED fees has reduced from 94% in 2014 to 91% in 2015. The reduction is attributable to an increase in average total NED fees of 6.5% from 2014 to 2015, although this could be related to increases in the number of NEDs on the board as well as increases in individual fees.
Table 3 summarises the changes from 2014 to 2015. Note that some of the samples are small.
Table 3: Changes in ASX 20 CEO fixed pay and NED fees from 2014 to 2015
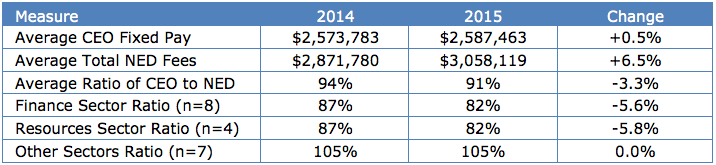
Figure 3 shows the change from 2014 to 2015 plotted against 2015 market capitalisation. It shows the continuing trend among the largest companies to set CEO fixed pay at levels that are lower than the total NED fees.
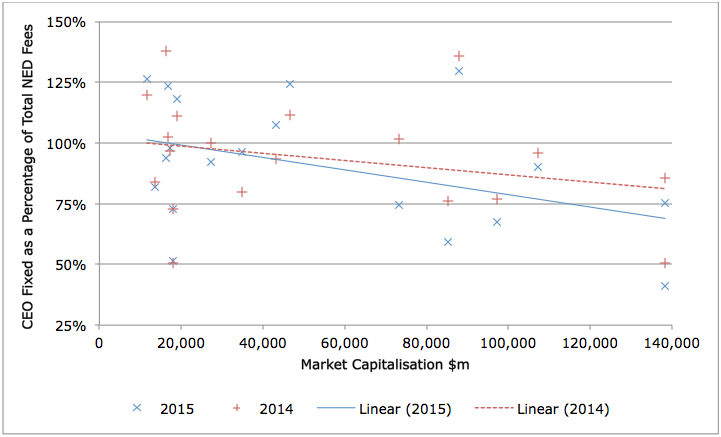
Figure 3: ASX20 CEO fixed as a percentage of NED fees plotted against market capitalisation
The finance and resources sectors have experienced CEO to NED fee ratio reductions, and CEO fixed pay now represents around 80% of total NED fees on average in these sectors. This is a lower ratio than in other sectors, primarily because of the higher NED fees in financial and resources companies. In the finance sector this is probably related to the workload associated with regulatory compliance. Higher fees in the resources sector probably relate to the global nature of their business.
Sectors other than finance and resources experienced no significant change in the average ratio of CEO fixed pay to total NED fees from 2014 to 2015.
© Guerdon Associates 2024
 Back to all articles


