
 Subscribe to newsletter

13/05/2019
Research suggests that up to a point, long non-executive director (NED) tenures are more beneficial to the company (see HERE) . Specifically, the research suggests that board tenure is positively related to forward-looking measures of market value and shareholder returns, with the relationship reversing after about nine years on average. The detrimental effect of longer average board tenure on market value (after an initial period of positive effects) is stronger for high growth companies.
Companies prefer to stagger NED appointments. This ensures a healthy cycle of NEDs. Newer NEDs tend to ask why a company does things more often. NEDs with more knowledge can add value on company risk, opportunities and operations. Longer service NEDs have valuable corporate memory should issues re-arise.
This would mean a mixed distribution of tenures within the board to bring different perspectives and opinions to the table.
Critics of annual board director elections indicate that this may contribute to a bias to less tenured directors on a board, as longer tenured directors may be held more to account for the inevitable skeletons that come out of most cupboards at some point.
Recent research in the US has shown that staggered board director elections are correlated with improved profitability down the line (see HERE) . This would seem counter to UK and US governance guidelines and preferences for annual elections for all directors. This is also advocated by the Australian Council of Superannuation Investors (ACSI) – see HERE .
Given the interest, Guerdon Associates examined director tenure diversity. We took NED data from current ASX 300 companies that have been in the ASX for at least 10 years. The NED tenures for each company was recorded and every NED was allocated into 3-year tenure brackets.
The longest NED tenure found was just over 43 years. Meanwhile there were 149 NEDs in 87 companies with a tenure of 12 years and above, which was 11% of the sample.
Figure 1 below illustrates the distribution of the average and median current NED tenures within the sample group.
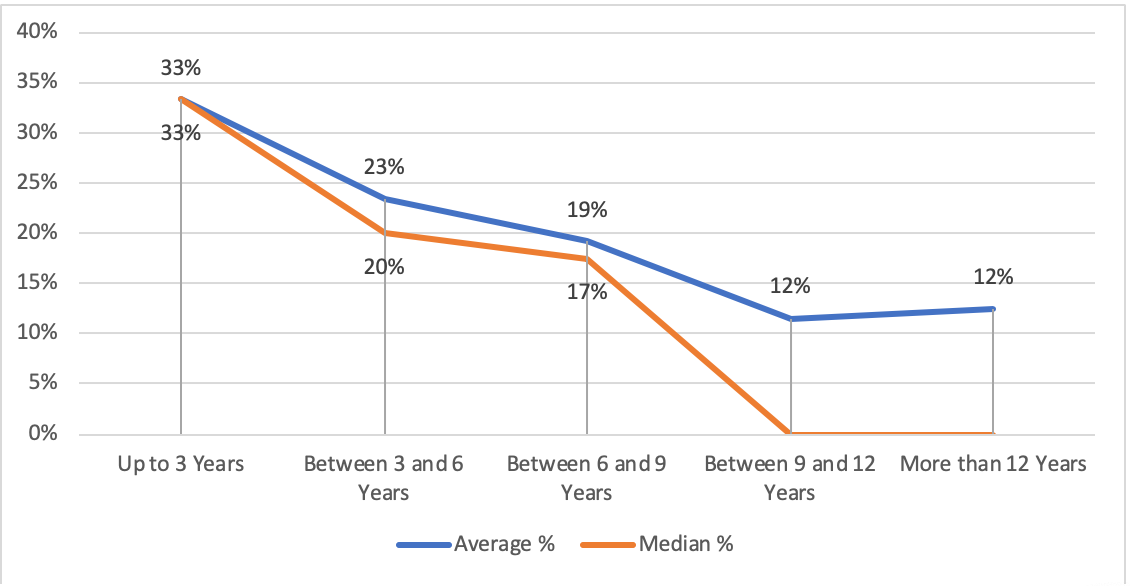
Figure 1: Distribution of average and median current NED tenures
It would appear that Australian boards are tilted to the inexperienced. Directors whose current tenure length is less than 3 years is group of directors constituting the highest proportion of NEDs, at 33%. Twenty-three percent of directors have a tenure of between 3 and 6 years, 19% between 6 and 9 years and 12% with more than 9 years.
By Market Capitalisation
Taking the quartiles for the market capitalisation of companies, we divided the sample to look at how the tenure diversity changes across company size.
Figure 2 below depicts the distribution between these different tenure groupings.
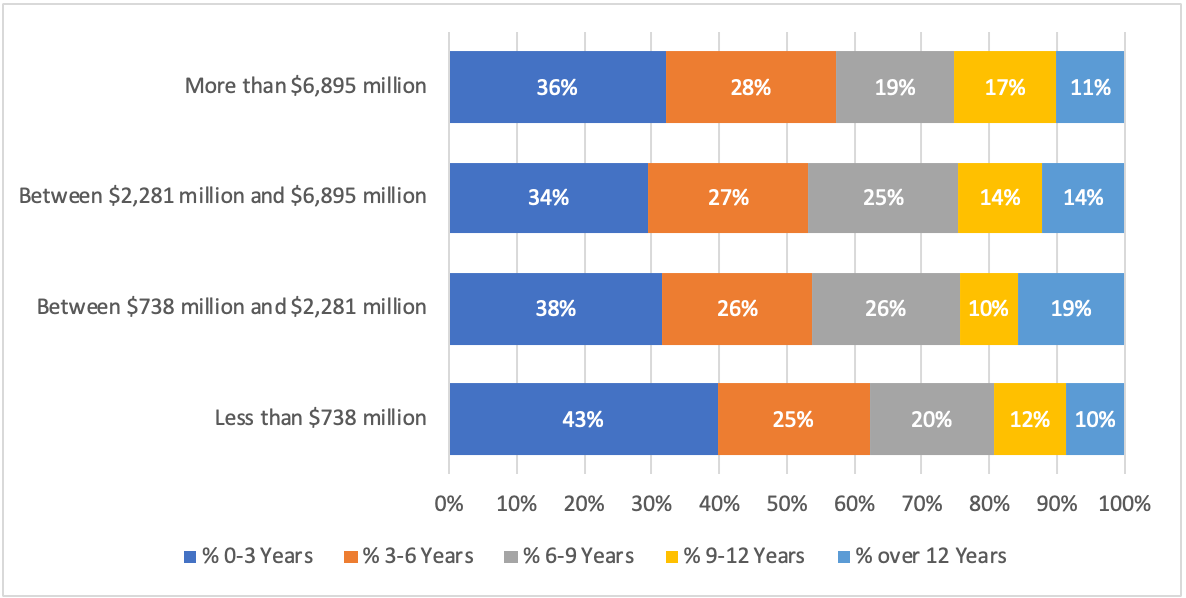
Figure 2: Distribution of current NED tenure by market size
Smaller companies with a market capitalisation of less than $738 million have, on average, 43% of their NEDs with board tenure of less than 3 years. This is the more than larger companies. Smaller companies also have the lowest proportion of NEDs with more than 12 years on the board, with an average of 10%.
By Industry
Figure 3 below presents the director tenure when the companies tested have been divided into the 11 GICS sectors.
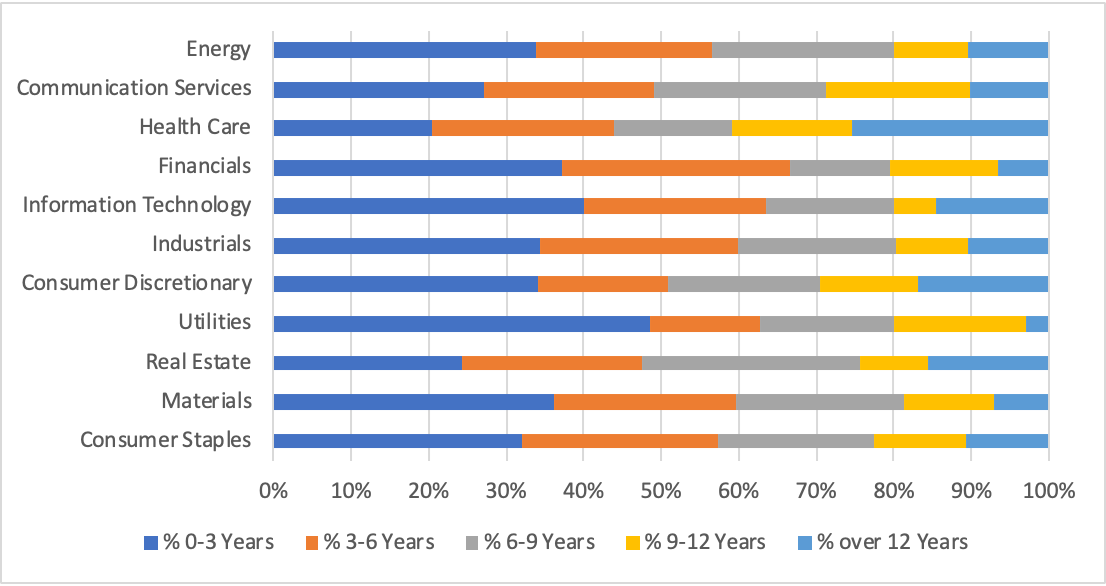
Figure 3: Distribution of current director tenure by industry
As seen in Figure 3 above, the utilities sector has the greatest proportion of NEDs whose current tenure is between 0 to 3 years at 49%. The health care sector also has the highest number of NEDs with 26% having a tenure of greater than 12 years.
Conclusion
ASX 300 companies appear to have boards with a diverse mix of director tenure.
Methodology
The data was derived from GuerdonData®.
NEDs that left or only joined midway through the company’s last financial year have been included in the study. NEDs that only joined a company after the financial year ended were not included in the study. Only companies that have been a part of the ASX for at least 10 years are a part of the study.
© Guerdon Associates 2024 Back to all articles


