
 Subscribe to newsletter

25/01/2019
As is the case annually, it is time to review the evolution of pay for the non-executive directors (NEDs) in the ASX 300.
Overall
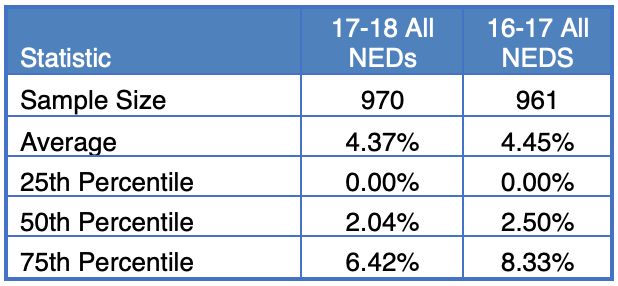
A total of 970 full year NEDs across 232 companies were used for the sample, taken from the statutory disclosures of companies in the ASX 300 between FY2017 and FY2018.
The median increase in remuneration was 2.04%.
This is lower than the increase between FY2016 and FY2017 which was 2.50% as indicated in Table 1.
Table 1: Non-executive director remuneration adjustment
Interestingly, the proportion of NEDs that received an increase and decrease in pay have both grown, to 61.24% and 17.73% respectively. As seen by the statistics above this resulted in an increase overall, but of a lesser amount than the prior year. A further breakdown can be seen in the table below.
Table 2: Percentage of NEDs by change in remuneration
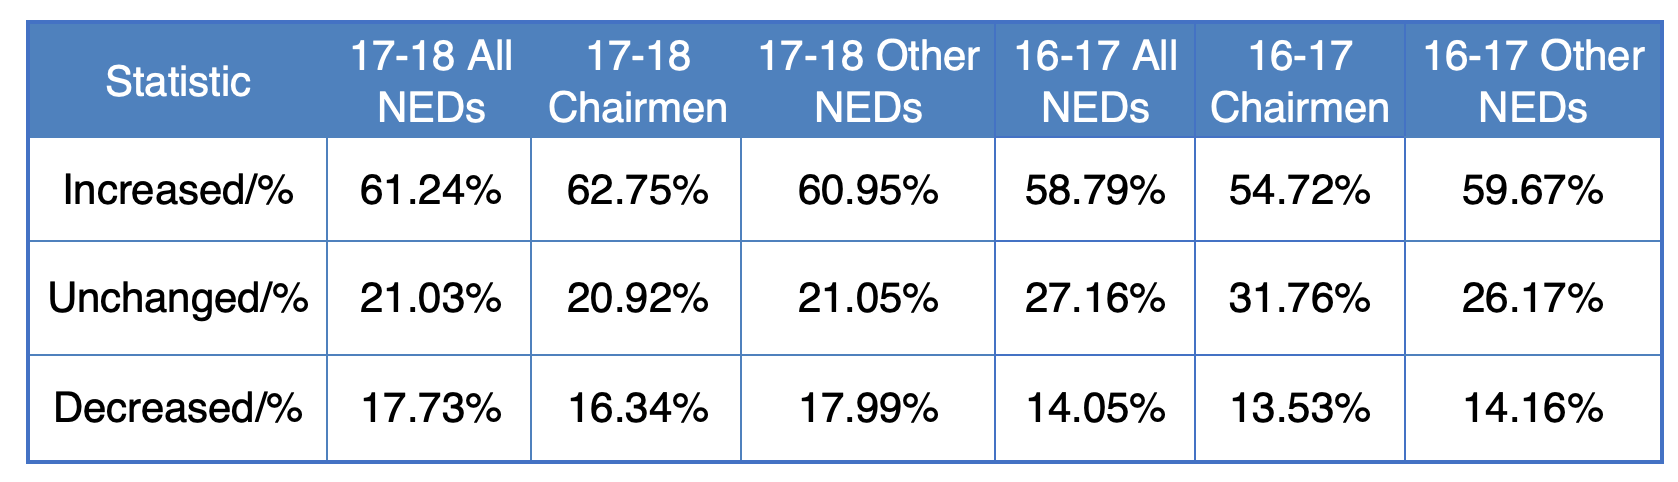
Figure 1 below highlights the changes in total remuneration for NEDs with respect to the company’s 30-day average market capitalisation from June 30th, 2018. This visually displays the factors seen above in Tables 1 and 2. This includes the large proportion of individuals with no change throughout the years. 50% of the changes fall within a 6.42% increase, with more companies receiving increases than decreases.
A new element which Figure 1 introduces is the 30-day market capitalisation. The figure suggests that there is little to no correlation between size of firm and remuneration increases of the board. A reason behind this may be the starting pay, as larger companies pay their boards more to begin with the large changes will consist of a smaller percentage.
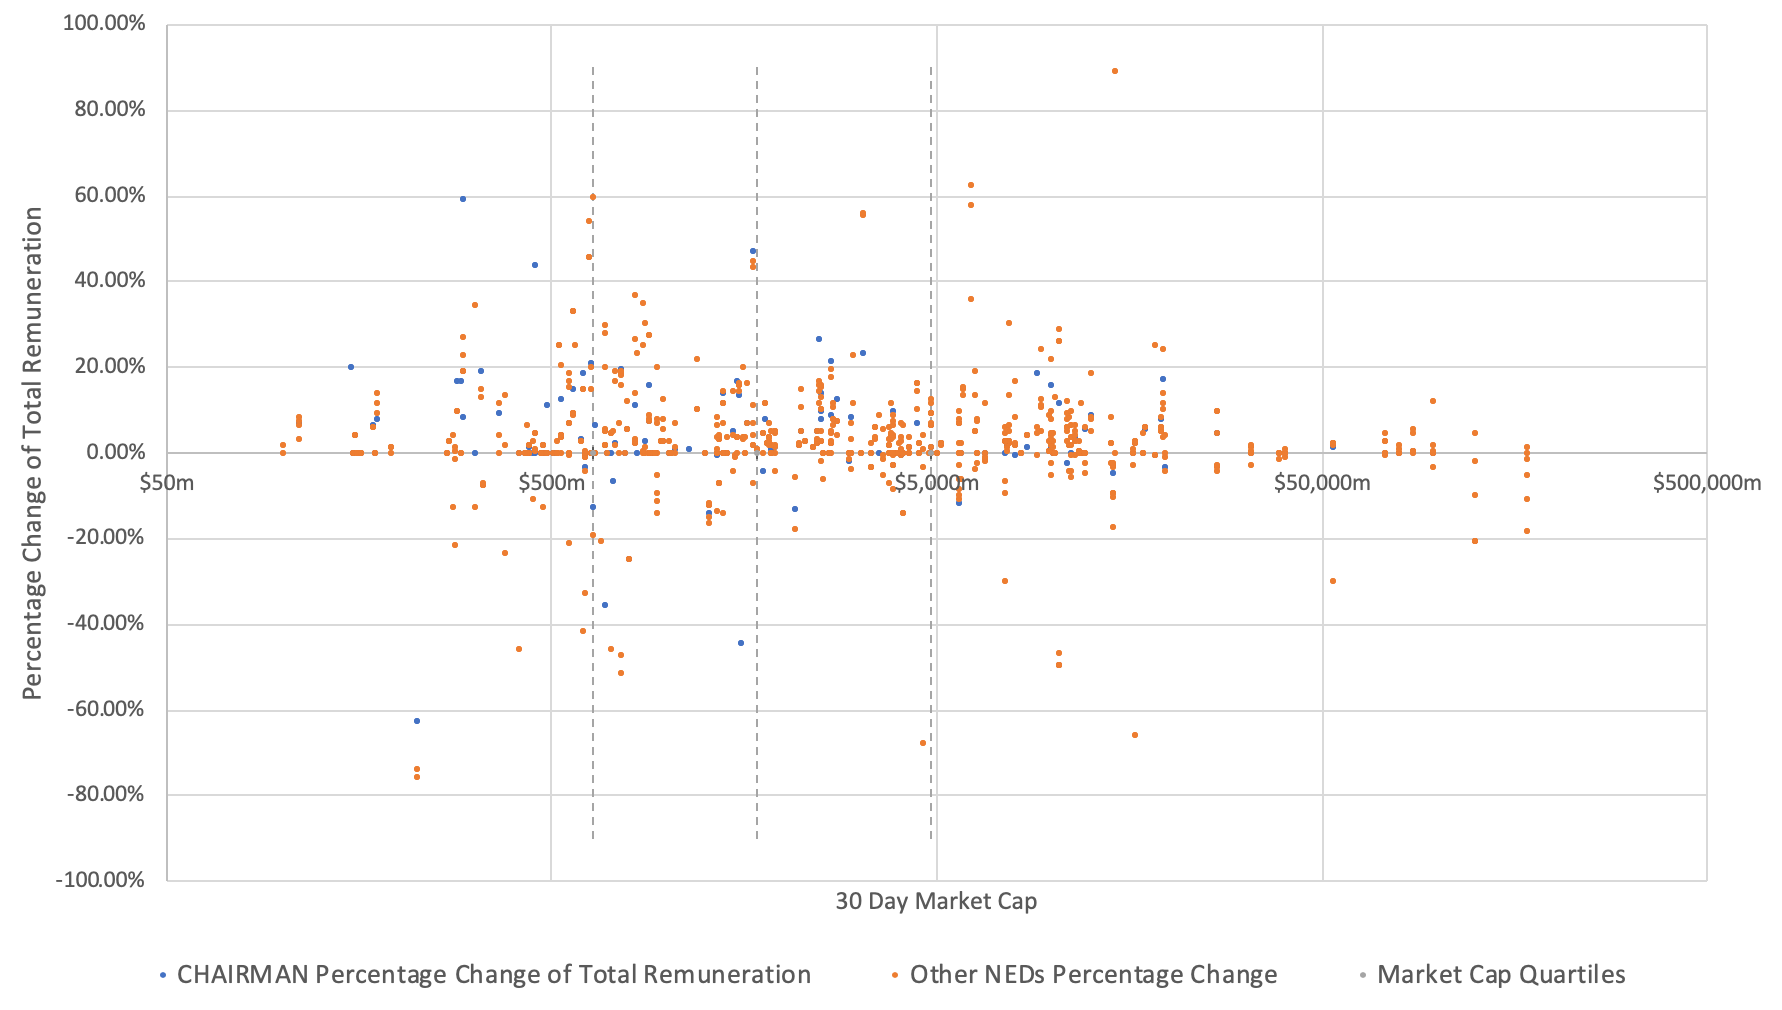
Figure 1: Scatter Plot of Change in NED Total Remuneration to 30 Day Market Capitalisation
As seen in Figure 2 below, the remuneration of NEDs tends to be between $100,000 to $200,000. There were more NEDs paid less than $150,000 in 2017 than in 2018, and more NEDs paid from $150,000 to $350,000 in 2018. Changes in this area are significant as it is the level at which the majority of NEDs are paid. This shows the distribution of changes that occurred from the increase in NED remuneration as described in Table 1.
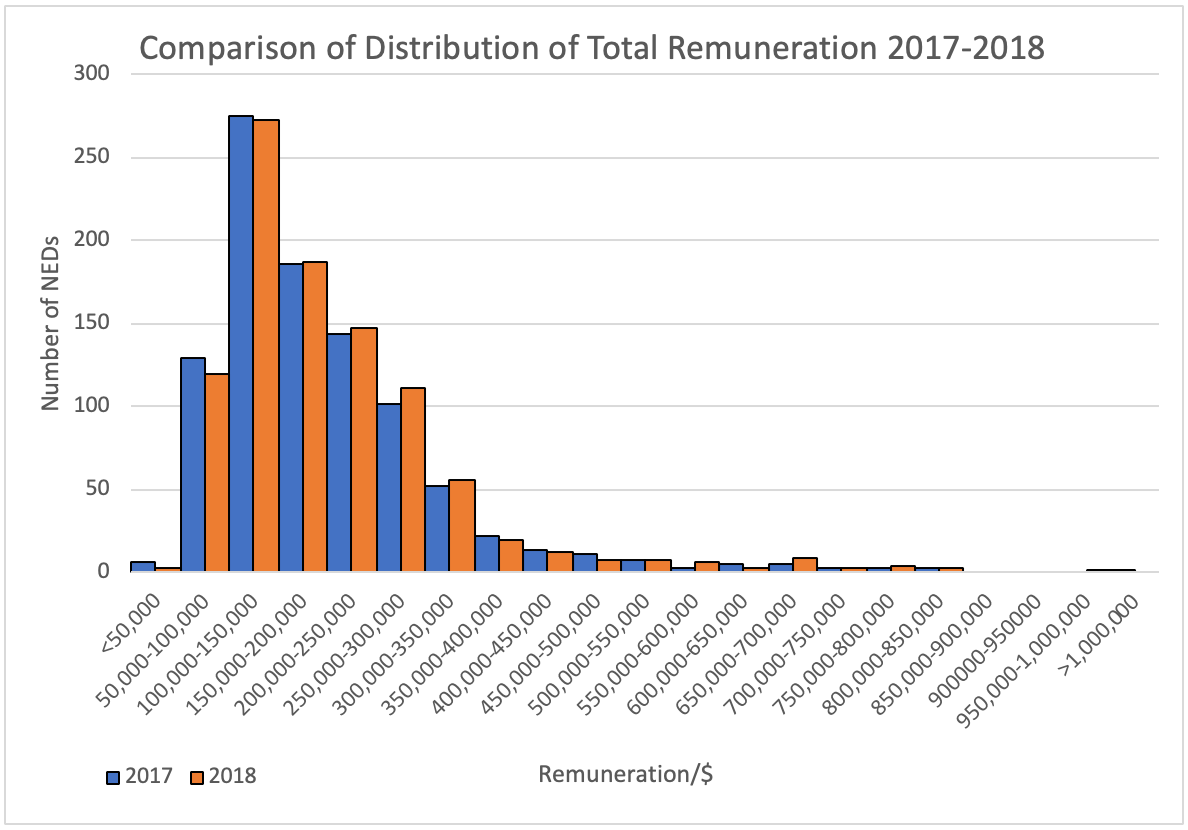
Figure 2: Comparison of Distribution of Total Remuneration
Compared to 2016-2017, 2017-2018 saw a relative increase of 0.37% in the percentage of NEDs receiving superannuation while the percentage of NEDs that have share-based payments had a relative decrease by 6.25% from 3.00%. This is despite legislation that provides for more flexibility regarding superannuation (see HERE), and NED equity (see HERE) .
Not all NEDs receive superannuation because of their remuneration agreements. Some NEDs are on terms where their remuneration payments are made to a separate entity. As such, there is no need to make contributions to the NED’s superannuation account according to the SGC.
By Position
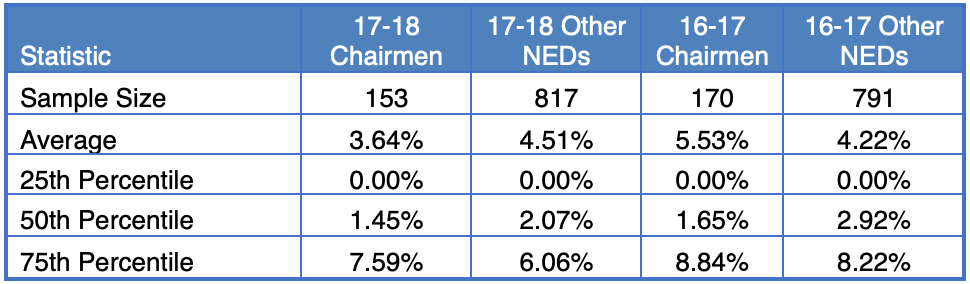
The median percentage change in remuneration achieved by chairmen in 2017-2018 was less than 2016-2017 by the amount of 0.2%. Other NEDs fared worse, facing a much smaller increase in their remuneration, being less by 0.85%.
Table 3: NED Remuneration adjustments by position
By Size
By taking the quartiles of the 30-day market cap of companies within our analysis, different categories were generated. The first, second and third quartiles are $640m, $1,702m and $4,815m, respectively. These serve as the cut-offs between the four size categories. Figure 3 below illustrates the number of NEDs in each GICS sector and for each size quartile.
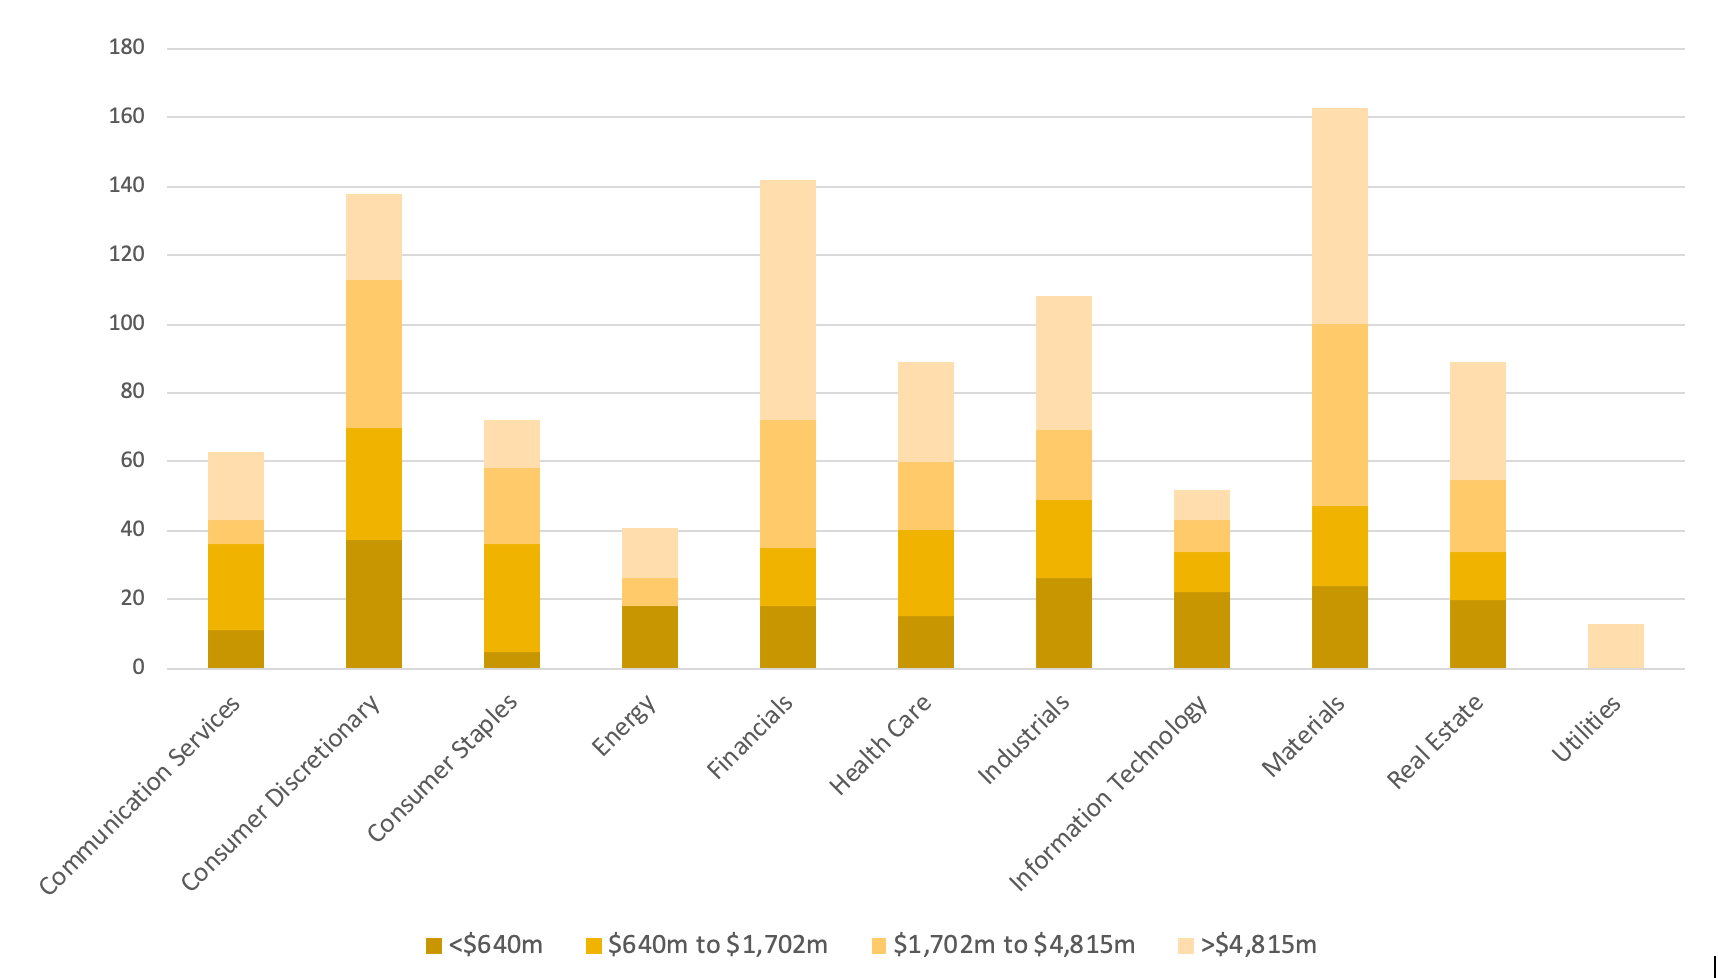
Figure 3: Number of NEDs by Category and Size
As can be seen in Figure 3, companies with larger market caps on average have a greater share of NEDs.
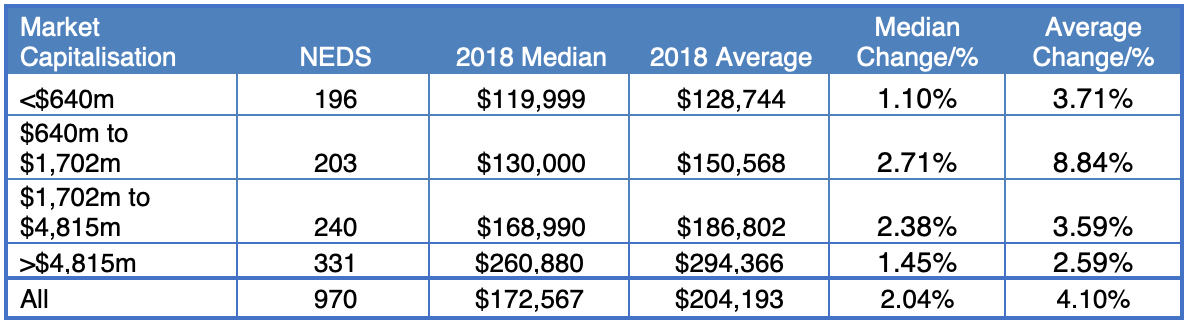
Based on Table 4 below, companies between $640m and $1,702m saw the largest change in median pay for NEDs in 2017-2018 of 2.71%. This goes to suggest that companies with a higher market capitalisation are already offering a higher level of remuneration, leading to more modest increases in terms of percentage.
On the other side lower quartile of companies with less than $640m of market capitalisation are offering the lowest increases to NED remuneration, with only a median percentage change of 1.10%. This would suggest that companies with lower levels of market capitalisation may have less ability to increase their NED compensation due to their lack of spare funds.
Table 4: Median and Average change in remuneration by company size
By Sector
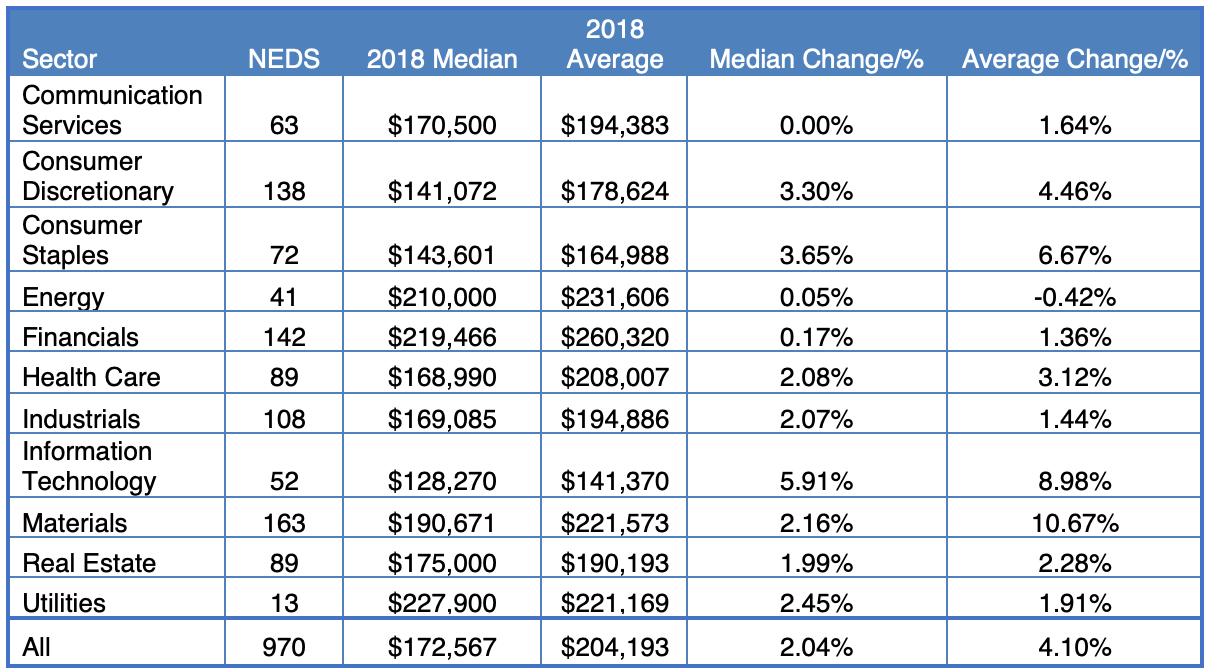
The smallest increases in remuneration this year were in the Communication Services, Energy and Financials GICS sectors with a median percentage change of 0%, 0.05% and 0.17%, respectively. For energy this continues the trend of stagnation in the NED compensation as the sector had the lowest median percentage change from 2016-2017. The relative decline of the financial sector can be viewed as a result of the royal commission.
The communication service sector was created in 2018 and defined by renaming the communications sector and introducing media and entertainment companies from the consumer discretionary sector and interactive media and service companies from the information technology sector. This combination led to the creation of this sector which also has the lowest median percentage increase in NED remuneration.
Meanwhile, the GICS sector that experienced the largest pay increase was the information technology sector, with an increase of 5.91% in the median. Redefining the GICS categories may have boosted the performance of the NED compensation as some companies were moved into communication services. The value of technology companies has increased significantly over the past year relative to the ASX 300 and could be the reason for this large increase in pay.
Table 5: Median and Average change in remuneration by industry
Methodology
The data was derived from GuerdonData©, which is the proprietary database by Guerdon Associates for executive and director pay for all companies in the ASX300. (Available for client subscription, to try our demo product, click HERE. For enquiries regarding a subscription, please contact us on info@www.guerdonassociates.com).
NEDs that changed position during the time of study were removed from the sample, as well as those who were not in their position for the full 2 years. Companies that were only added or removed from the ASX300 during the duration of the sample time period have also been removed from the study.
The market capitalisation of companies was taken on a 30-day average from the 30th of June 2018. Therefore, for companies that were delisted between the end of FY2018 and this time period, we were able to take their market capitalisation from that time period.
Exchange rates for directors paid in a foreign currency was taken as the daily average for the respective exchange rate during the relevant financial year.
Calculations and percentages were made on each NED’s change in remuneration.
© Guerdon Associates 2024 Back to all articles


