
 Subscribe to newsletter

07/12/2020
Guerdon Associates are continually analysing Short Term Incentive (STI) award outcomes to determine the likelihood that executives achieve STI objectives.
Last month, Guerdon Associates published an article breaking down STI award outcomes as a percentage of target and maximum (see HERE).
This month, we will put our focus on breaking down STI award outcomes into each sector, based on the Global Industry Classification Standard (GICS).
The charts below display the sectors with the highest STI award outcomes as a percentage of target STI and maximum STI.
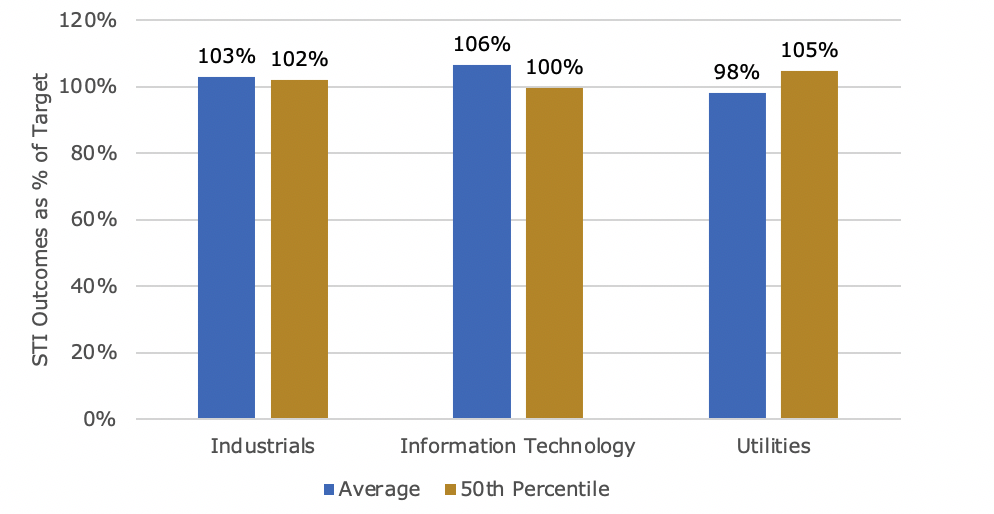
Figure 1: Sectors with highest STI award outcomes as a % of Target STI
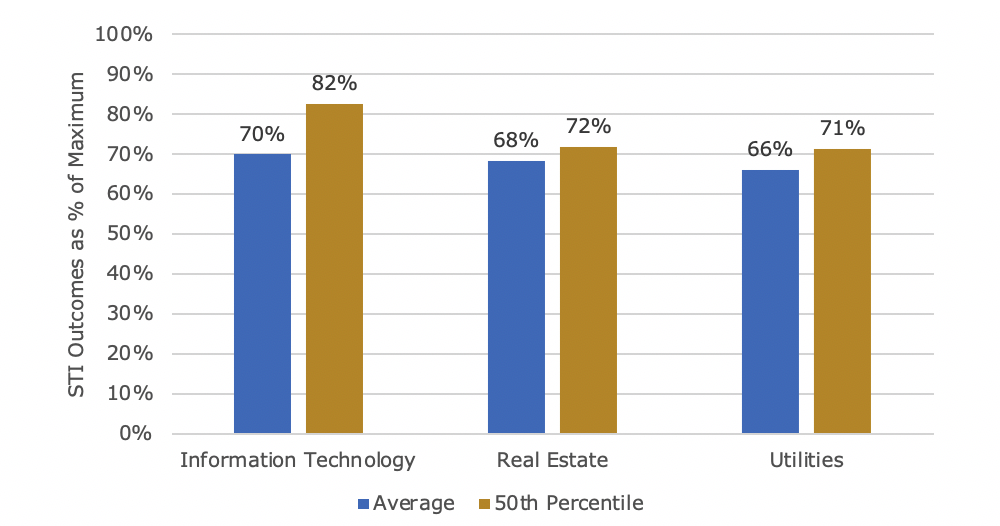
Figure 2: Sectors with highest STI award outcomes as a % of Maximum STI
Companies in the Information Technology sector had the highest average STI award outcomes as percentages of target and maximum STI. Average STI outcomes were at 106% of target and 70% of maximum. This may reflect the technology boom in recent years and the war for talent as Australian technology companies race to list (see HERE).
Companies in the Utilities sector also had one of the highest STI award outcomes as both percentages of target STI (with average award of 98%) and maximum STI (with average award of 66%). It will be interesting to see if this is maintained given the tumultuous change in energy distribution and generation stemming from technology, varying state responses to regulation, and the absence of federal government coordination.
The Industrials sector had one of the highest STI award outcomes as a percentage of target STI only, with an average outcome of 103% of target. The Real Estate sector had one of the highest STI award outcomes as a percentage of maximum STI only, with an average of 68% of maximum STI awarded.
The reason two different sectors achieved high STI award outcomes at target and maximum is likely due to the number of companies that did not report a target STI. These companies were excluded from target STI statistics. As reference, only sixteen of the 30 Real Estate companies with a maximum STI disclosed the target STI. Thirty-one of the 38 Industrials companies with a maximum STI disclosed the target STI.
The charts below display the sectors with the lowest STI award outcomes as a percentage of target STI and maximum STI.

Figure 3: Sectors with lowest STI award outcomes as a % of Target STI
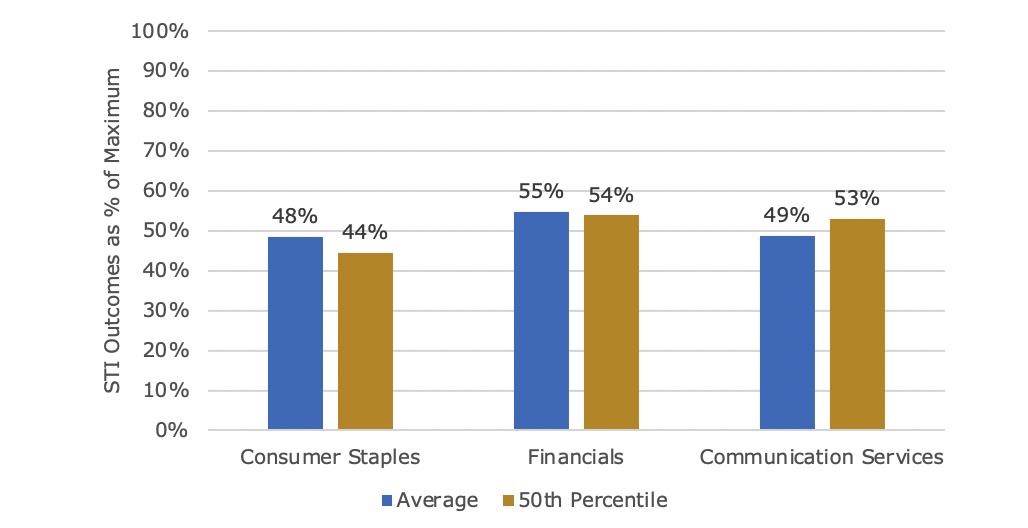
Figure 4: Sectors with lowest STI award outcomes as a % of Maximum STI
The Consumer Staples sector had one of the lowest average STI award outcomes as percentages of target and maximum STI. In a previous article, Guerdon Associates displayed the results of Long Term Incentive (LTI) vesting analysis across sectors, and consumer staples had one of the lowest LTI vesting outcomes over FY17 to FY19 (see HERE).
This opens the question to if the incentives are appropriately set for Consumer Staples companies, and if structures can readily adapt for flexible responses to such things as a pandemic and technology changes.
The relatively low STI award outcomes in the Financial sector as percentages of target and maximum can be attributed to the royal commission from 2018 to 2019, where certain financial institutions were found to be engaged in misconduct, additional regulatory shortfalls since, and the initial impact of the pandemic.
The Consumer Discretionary sector had the one of the lowest STI award outcomes as a percentage of target STI. Communication Services sectors had one of the lowest STI award outcomes as a percentage of maximum STI. This could be a result of the different samples since no assumptions are made on companies that do not disclose target STI. Only twenty two of the 41 Consumer Discretionary companies that disclosed a maximum STI also disclosed a target STI. Twenty of the 23 Communication Services companies that disclosed a maximum STI also disclosed a target STI.
We expect to continue to release more information over the coming months as we uncover more interesting trends and insights from the data. In the meantime, contact us if you would like assistance in adapting this data and information into your next remuneration plan.
© Guerdon Associates 2024 Back to all articles


