
 Subscribe to newsletter

10/06/2016
Last month we reported a median increase in non-executive director (NED) remuneration of 2.4% from 2014 to 2015. Following on from these results, this month we break down the overall data by sector and company size.
We derived our results by analysing the change in non-executive director remuneration from 2014 to 2015 with data downloaded from GuerdonData®. To validly determine the rate of increase, we calculated the change in fees for each individual NED (this is the ‘incumbent-weighted’ increase).
The 663 such NEDs (excluding chairmen and deputy chairmen) were drawn from 264 ASX 300 companies from all industries. Newly listed companies and companies listed on foreign exchanges that do not disclose remuneration in Australia were excluded. The market capitalisation of these companies ranged from $46 million to $129 billion, based on a 30-day average to 30 April 2016.
Changes by industry
Median increases in fees were the largest for directors in the health care and utilities sectors, with the median change in total remuneration at or above 5%. These were also the sectors with the highest proportion of NEDs receiving an increase.
The same result was found when we undertook the analysis a year ago.
Table 1: Median change in total remuneration for directors by industry (excluding chairmen)
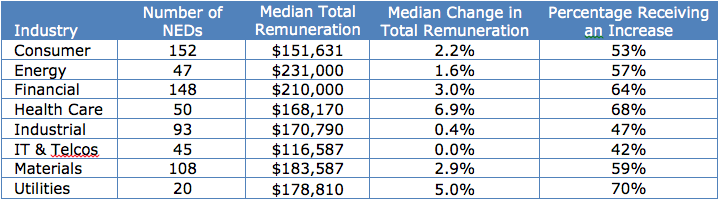
There were some significant increases in Health Care NED fees that reflect the introduction of, or increased size of, NED equity grants among biotech companies in 2015.
Fee reductions in the materials and energy sectors that we reported last year appear to have ceased, with more than half the NEDs experiencing an increase in fees during 2015.
Figure 1 below shows the interquartile range for the increases in fees in 2015 by sector.
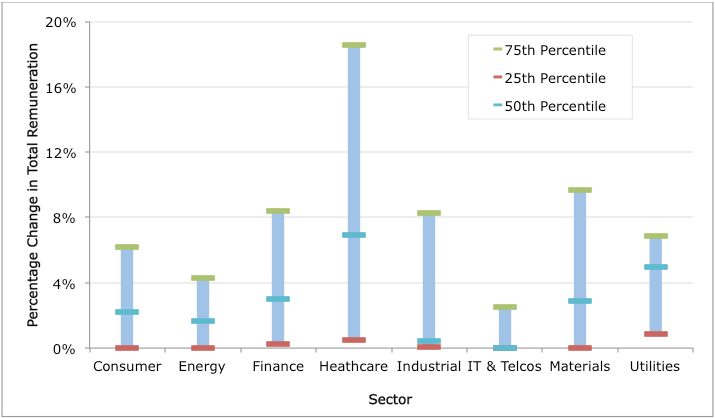
Figure 1: Inter-quartile range of percentage change in total remuneration by sector
Changes by size
The 264 companies used in the analysis were split into quartiles based on market capitalisation. Since larger companies tend to have larger boards, the number of NEDs in the top quartile companies is higher.
Table 6: Median change in total remuneration for directors by company size
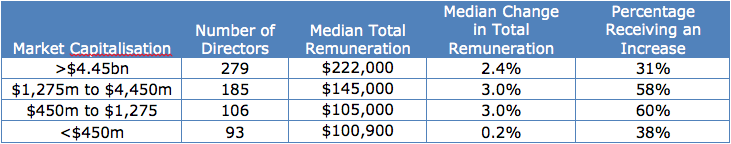
Increases in NED fees were consistent across the sample, with the exception of the companies in the smallest company size group. The median fees received by this group of NEDs represent 96% of the median of the next largest group. This compares with 82% when we conducted the analysis last year. We infer that the cause relates to the significant reduction in the market capitalisation of companies affected by dropping commodity prices and the consequent shift into a smaller size category. For these companies, the fees were established when the market capitalisation was higher and most likely benchmarked in the past against similarly sized companies at the time. Therefore their fees are higher than might otherwise be expected, given their current market capitalisation.
The proportion of NEDs receiving an increase is higher than the proportion in our analysis last year for the largest three size groups.
The inter-quartile range for the increase in total remuneration by company size is shown in Figure 2 below.
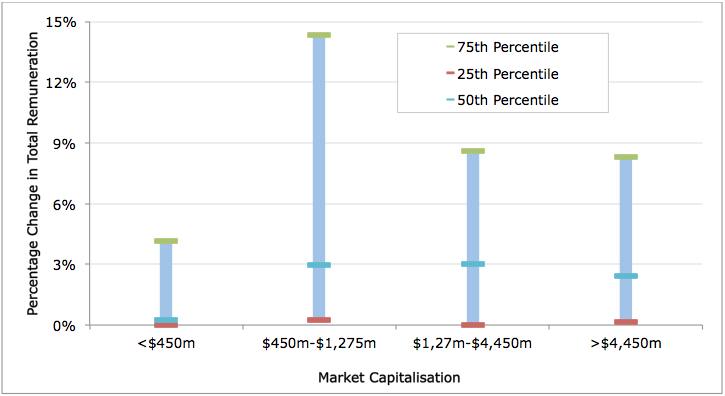
Figure 2: Inter-quartile range of percentage change in total remuneration by company size
Directors of larger companies tend to have more consistent increases in fees over time. That is, there are fewer very large increases or decreases in fees among larger companies. This may be due to the higher regularity of fee increases in this group, the high degree of scrutiny of this group of companies, and the mature stage and modest growth at which most now operate.
© Guerdon Associates 2024 Back to all articles


