
 Subscribe to newsletter

09/11/2020
Guerdon Associates are continually analysing Short Term Incentive (STI) award outcomes to determine the likelihood that executives achieve STI objectives.
Taking the constituents of the ASX200 at the start of 2020, our research and analysis examined CEO award outcomes for STI plans with performance periods ending in FY18 and FY19. We ignored 2020 due to the extraordinary impact of COVID-19 (see HERE ). In our definition, an STI plan is an incentive plan where the performance period is measured over one year or less, regardless of the payment vehicle and timing of payment.
CEOs not offered STI opportunities were excluded from analysis. No assumptions were made about STI quantum at target or maximum (those not disclosed were excluded from analysis). CEOs whose STI outcomes were zero were included in the analysis, as a reflection of the CEO not meeting threshold performance levels.
We have broken down the analysis by:
- Financial year
- Sector, based on the Global Industry Classification Standard (GICS); and
- Size groups, proxied by indices (ASX 20, ASX 50, ASX 100, ASX 200)
Over the two years, 60% of ASX 200 companies disclosed a target STI opportunity. Approximately 86% of companies disclosed a maximum STI opportunity for awards at stretch performance.
This article will focus on the overall STI outcomes, as well as STI outcomes split by financial year. Future articles will break down the analysis within sectors and size groups.
For all companies that disclosed both target and maximum STI, the following table displays summary statistics of disclosed target STI as a percentage of disclosed maximum STI.
Table 1: Target STI as a % of Maximum STI
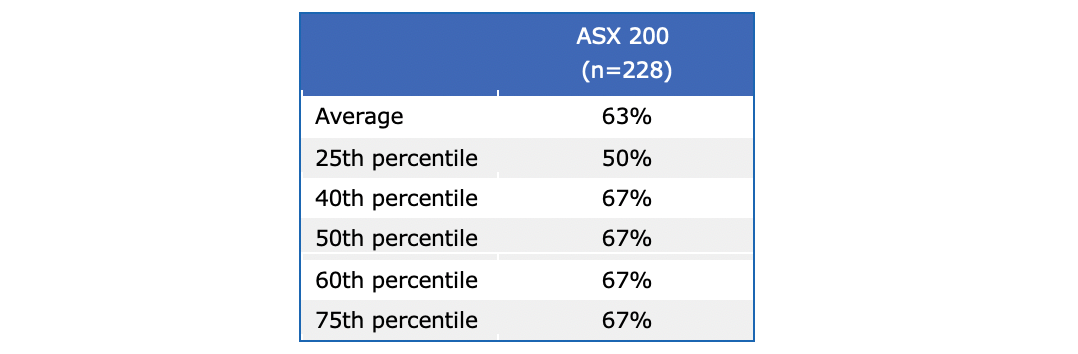
That is, ASX 200 companies typically set the target STI at 67% of maximum STI.
The table below displays summary statistics for the STI performance outcomes over the two years.
Table 2: ASX 200 STI Outcomes
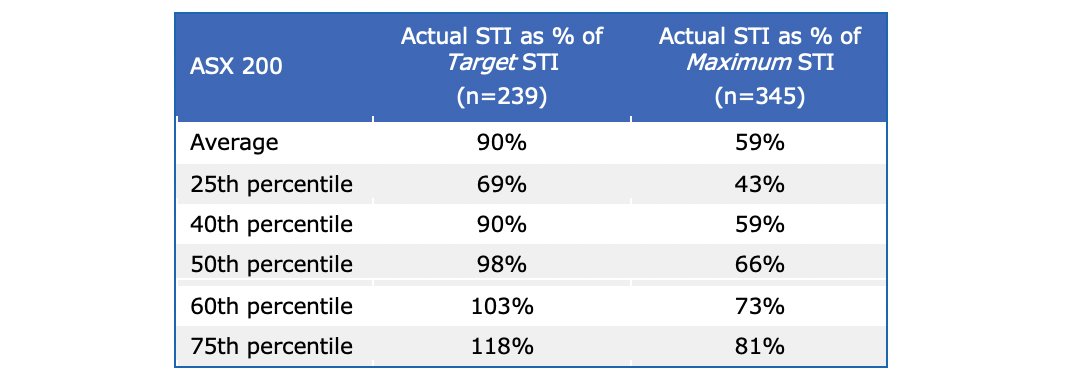
The average STI outcome was 90% of target STI, and the median STI outcome approximated the target opportunity. It appears that boards have been quite skilled in setting STI performance measure requirements and vesting such that payments are at about target.
In normal times (i.e. not 2020) executives may reasonably expect to get at least their target STI awarded.
Note also that at the 25th percentile the outcome was 69% of target and 43% of maximum, illustrating that very low STI outcomes are unusual.
The below figure shows the change in STI outcomes between FY18 and FY19.
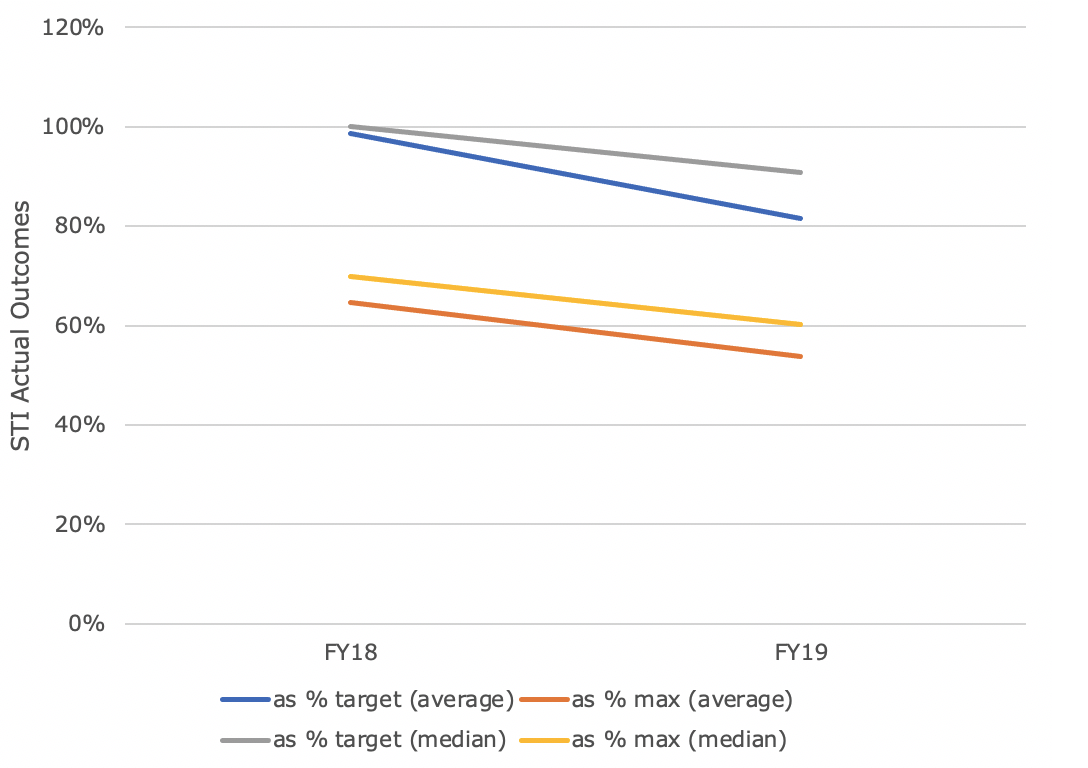
Figure 1: Actual STI outcomes, by financial year
The figure above shows that the average and median STI outcomes decreased in FY19 relative to FY18. One reason could be a better economic year in 2018, with annual GDP growth of 3.3% at July 2018 compared to annual GDP growth of 1.6% at July 2019 (See GDP spreadsheet HERE). The ASX 200 return was not dissimilar between the two years, TSR being 13% from 1 July 2017 to 30 June 2018 and 12% from 1 July 2018 to 30 June 2019.
© Guerdon Associates 2024 Back to all articles


