
 Subscribe to newsletter

09/03/2020


Guerdon Associates has continued their annual study of remuneration report votes to determine any relationships behind voters’ actions.
Utilising the percentage of votes against the remuneration report, total shareholder return (TSR), Total Assets, and return on equity (ROE), over a period of 8 years for the ASX 300, we explored potential relationships between these parameters.
In previous articles by Guerdon Associates (see HERE) and (see HERE), a similar analysis was completed. This analysis builds on prior studies with the addition of 2019 annual general meeting (AGM) season’s data.
Two statistically significant relationships were found:
1 . TSR was found to be negatively related to votes against while
2 . Larger companies, with relatively higher Total Assets, were found to be positively related.
Although ROE appears to be a logical measure, it was found to not impact on shareholders’ remuneration report vote.
These results are consistent over eight years of data.
Analysis
Guerdon Associates has utilised data for votes on remuneration reports for ASX 300 companies from 2012 to 2019 to calculate a percentage of votes against the remuneration report.
The TSR, Total Assets and ROE for the financial year prior to the AGM were also used.
TSR is the payoff a shareholder has received over the prior year. Total Assets serves as a control to measure differences in companies’ size. ROE represents the return on equity, and represents a measure of shareholder return that is not impacted by market sentiment.
These metrics represent the independent variables that were regressed against shareholders’ remuneration “no” vote percentages. That is, statistics were applied to determine the extent that TSR, Total Assets, and ROE each have on the extent of remuneration report “no” votes.
TSR – better to do better
Consistent with the previous analyses, TSR for the year up to the AGM was shown to have a negative impact on votes against the remuneration report. This means that a lower TSR will increase the chance of a vote against the remuneration report. The outcome suggests that as shareholders receive a lower return they would be more likely to express their dissatisfaction with the way the company is being run and the compensation being awarded to executives by voting against the remuneration report.
This effect has a p-value of 0.002, meaning there is only a 0.2%, or 2 cases in a thousand, that this is due to chance.
When dividing the TSR into 10 groups based off their percentile, the trend stays the same .
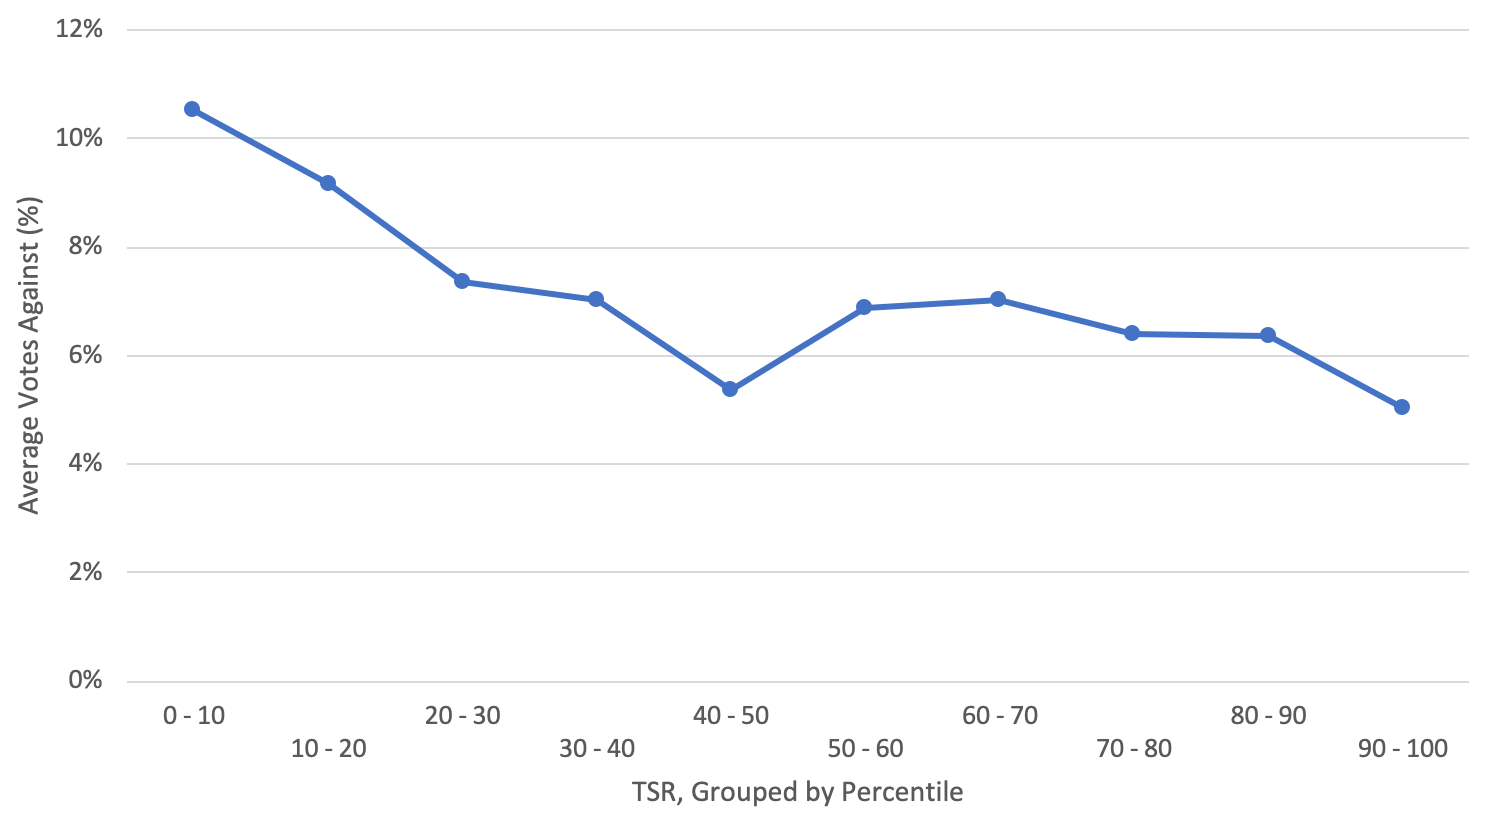
Figure 1: TSR Groups & Average Votes Against Remuneration Report
The average votes against the remuneration report percentage is declining steadily as the percentile increases. A company that falls in a higher percentile of TSR in a given year is less likely to receive votes against. The trend is consistent with the exception of firms that fall between the 40th and 50th percentile. This outlier is not significant enough to affect the overall result concerning TSR and votes against the remuneration report.
As this trend shows the same effect as is seen in the regression analysis, this should be taken as further evidence of the strong relationship between TSR and votes against the remuneration report.
Total Assets – better to not be too large
Total Assets were again included to test the idea that being larger makes it more likely for shareholders to vote against the remuneration report. Total Assets were collected for the financial year prior to the AGM.
Consistent with the previous analysis, Total Assets were found to be statistically significant and to be positively related to the proportion of “no” votes. Therefore, the more assets the company has, the more likely a vote against. This has a p-value of 0.00001, meaning there is only a 0.001%, or 1 case in 100,000, that this is due to chance.
What this means is larger companies always have a struggle to prevent votes against their executives’ remuneration packages, even if they have good annual TSRs.
The following scatter plot presents Total Assets against the proportion of votes against the remuneration report with the trendline being upward sloping. Note that the scale of the X axis is logarithmic thus creating the appearance of a curve in a linear line.
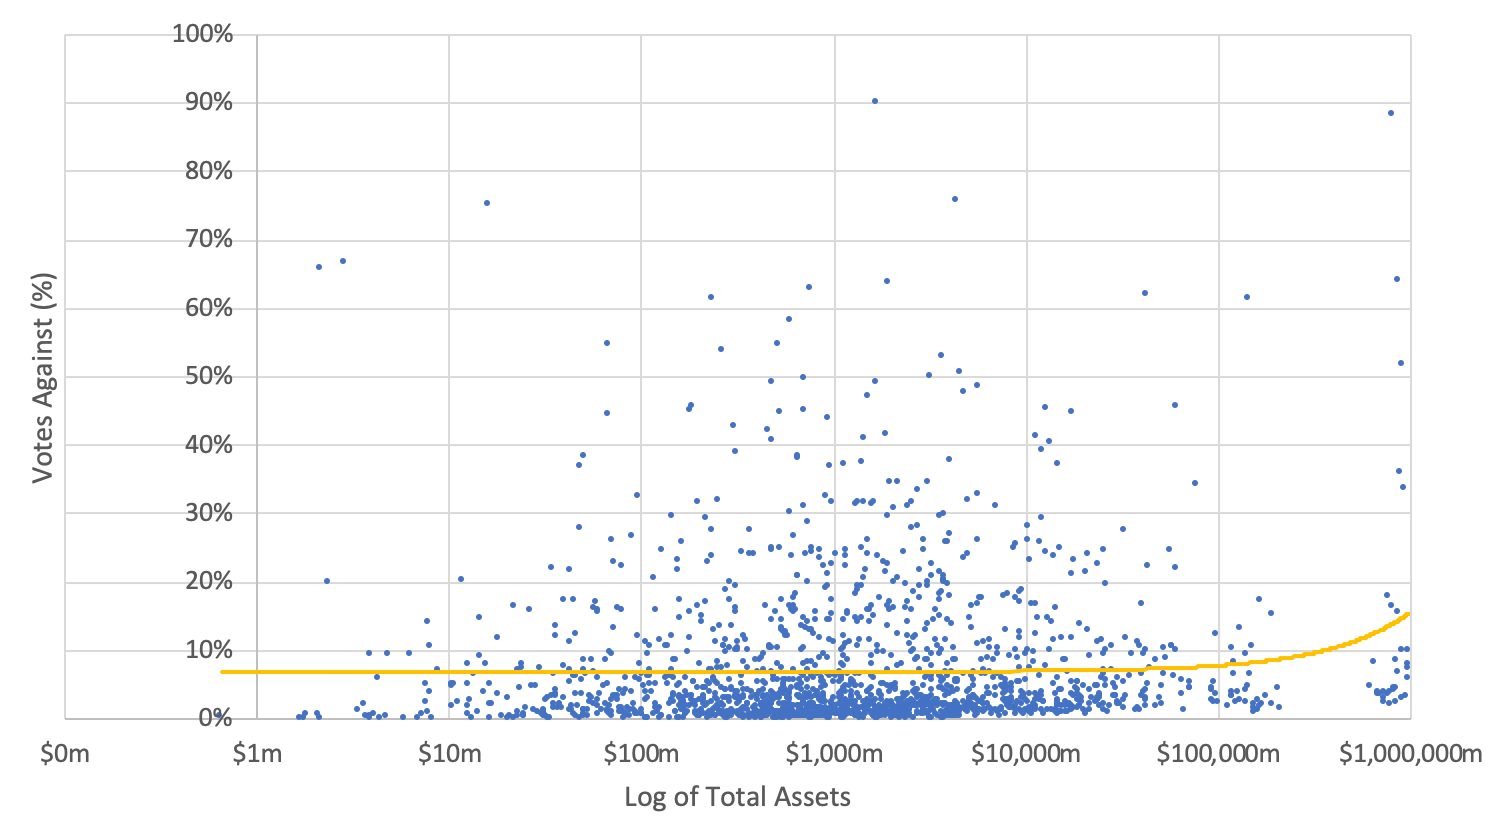
Figure 2: Total Assets & Votes Against Remuneration Report
ROE
ROE depends less on market sentiment than annual TSR and relies on metrics that executives have control over.
Regressions between ROE and votes against the remuneration report were found to be insignificant. That is, no strong relationship was found between votes against the remuneration report and ROE over multiple years. The lack of a relation is consistent with the previous years’ analyses.
Yearly Trends
No significant relations were found between different financial years and votes against the remuneration report. This is consistent with the previous analysis and reinforces the importance of annual TSR and Total Assets in the vote on the remuneration report.
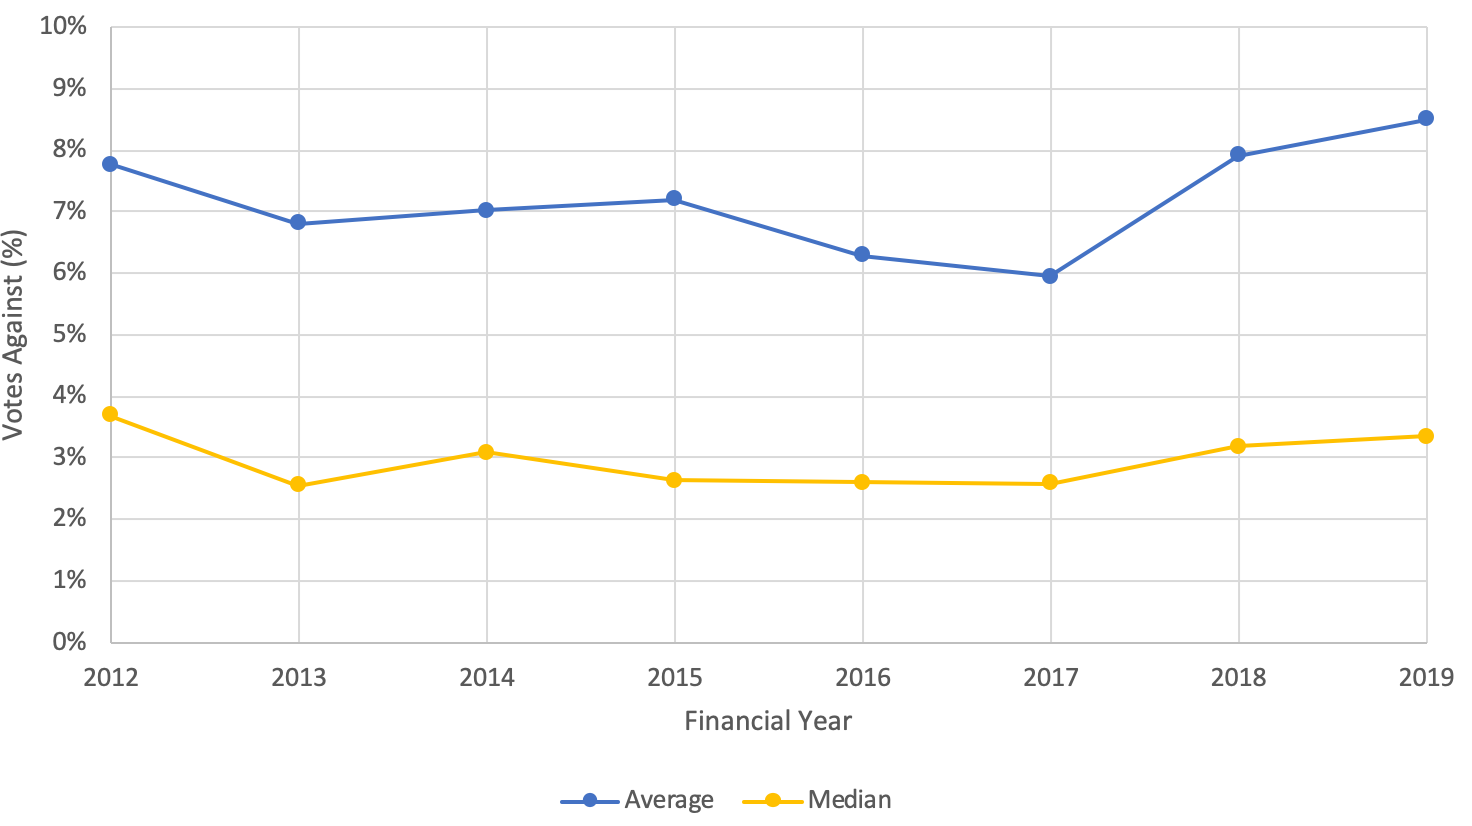
Figure 3: Yearly Average and Median Votes Against Remuneration Report
The median votes against are relatively stable across all years. The average votes against are also relatively stable except for a large increase in FY2018. Note as the median is significantly lower than the average, a small number of companies are attracting large no votes.
Companies with a financial year ending in December have not been included in the 2019 data as there have yet to be meetings for these companies. This may create some skews in the 2019 data that are unavoidable at this point in time.
Conclusion
Findings were consistent with the previous analysis.
TSR is negatively correlated with “no” votes. Weak TSR results in higher “no” votes while strong TSR results in lower “no” votes.
Company size, by way of total assets, is positively correlated with “no” votes. Larger companies have more difficulty minimising the number of votes against their remuneration report compared to smaller companies.
Good ROE performance is overshadowed by TSR when it comes to remuneration report votes.
For all the recent talk that companies, and their boards, should focus on sustainable long-term results, once again the data tells us that these views are not shared by many investors.
Methodology
To analyse the effect of Total Shareholder Return (TSR) on pay voting outcome, we considered companies in the S&P/ASX300 and applicable financial measures. Voting outcomes were sourced from Bloomberg and relevant disclosures. We only examined companies that held AGMs to vote for the adoption of remuneration reports between 2012 and 2019, which reduced total observations to 1770.
The best regression found was:
Votes_Againsti = α + β1*TSRi + β2*Assetsi + β3*ROEi + β4*2013 + β5*2014+ β6*2015+ β7*2016+ β8*2017+ β9*2018+ β10*2019 + εi
i = 1,…, N
where Votes_Againsti is a logit transformation (the natural logarithm of x/(1-x) where x is the votes against). TSRi was taken as a one-year total shareholder return up to the AGM date. Assetsi was Total Assets and ROEi was Return on Equity of the ith company respectively, with N = 1770 observations. The years within the equation serve as dummy variables and refer to the financial year end.
© Guerdon Associates 2025 Back to all articles


