
 Subscribe to newsletter

05/03/2019


Every board fears a vote against their remuneration report. This study considers what may be behind the voter’s actions.
Utilizing the percentage of votes against the remuneration report, total shareholder return (TSR), Total Assets and return on equity (ROE), over a period of 7 years for the ASX 300, a compelling relationship can be built between some of the parameters.
In a previous article by Guerdon Associates (see HERE) a similar analysis to this one was completed. This analysis builds on the previous one by introducing more years of data.
Two statistically significant relationships were found in this analysis.
TSR was found to be negatively related to votes against while larger companies, containing more Total Assets, were positively related. Although ROE appears to be a more logical measure, it was found to not impact on shareholders’ votes on the remuneration report.
Furthermore, these results were consistent over seven years.
Analysis
Guerdon Associates has taken data from 2012 to 2018 on ASX 300 remuneration report votes. This has been utilised to calculate a percentage of votes against the remuneration report. The TSR, Total Assets and ROE for the year prior to the annual general meeting (AGM) was also gathered.
Total Assets serves as a control to measure differences in companies’ size. TSR is the payoff a shareholder has received over the prior year. ROE represents the return for the entire pool of equity, less individualized than TSR but still represents a measure of but is a measure of shareholder payoff.
TSR
TSR for the year prior to the AGM was shown to have a negative impact on votes against the remuneration report. This means that a lower TSR will increase the chance of a vote against the remuneration report. The outcome is sensible as shareholders that receive a lower return would be more likely to express their dissatisfaction with the way the company is being run by voting against the remuneration report. This effect has a p-value of 0.004, meaning there is only a 0.4% chance this is due to luck.
Dividing the TSR into 10 groups based off their percentile the trend is the same.

Figure 1: TSR Groups & Average Votes Against Remuneration Report
The average votes against the remuneration report percentage is declining steadily as the percentile increases. A company that falls in a higher percentile of TSR in a given year is less likely to receive votes against. The trend is consistent with the exception of firms that fall between the 40th and 50th percentile. This outlier is not significant enough to affect the overall result concerning TSR and votes against remuneration report.
As this trend shows the same effect as is seen in the regression shown in the analysis, this should be taken as further evidence of the strong relationship between TSR and votes against the remuneration report.
Also, when all the data is viewed as a scatter plot, a trendline clearly shows the negative relationship between TSR and votes against the remuneration report.
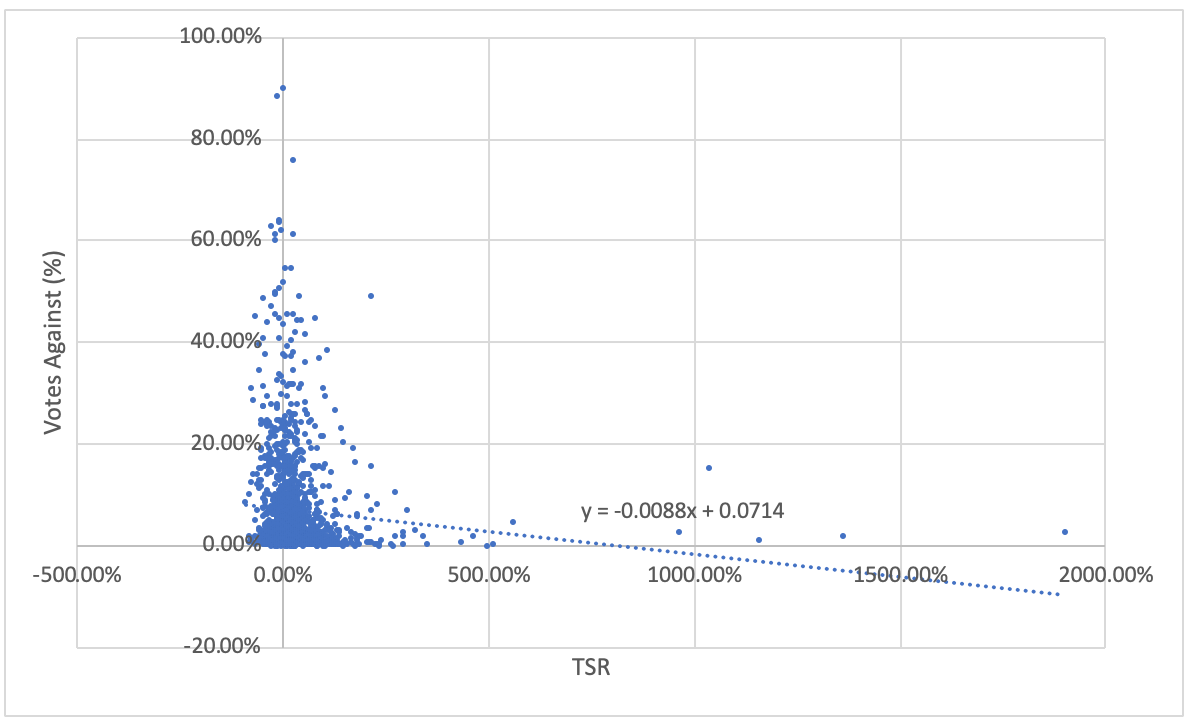
Figure 2: Annual TSR & Votes Against Remuneration Report
ROE
Arguably ROE is a more logical measure to base remuneration off rather than annual TSR. It takes into account financial performance that is an indicator of intrinsic value. Also, it depends less heavily on the whims of the market than annual TSR and more on real underlying metrics over which management has influence.
Within the previous Guerdon Associates study this was statistically significant, but over 7 years it is not.
Total Assets
The purpose of including Total Assets was to test the idea that being larger makes it more likely for the shareholders to vote against the remuneration report.
Over a longer time period, Total Assets in the year prior to the AGM were statistically significant. Total Assets had a positive effect, meaning the more assets the company has, the more likely a vote against. This effect has a p-value of 0.0001, meaning there is only a 0.01% chance this is due to luck.
This may be related to the absolute size of executive remuneration. However, this factor was not directly tested in this study.
It may also be related to larger companies achieving lower TSR than smaller companies. This was not tested on this occasion.
As can be seen by the following scatter plot, total assets have an upward sloping trendline. Note, the scale of the X axis is logarithmic thus creating the appearance of a curve in a linear line.
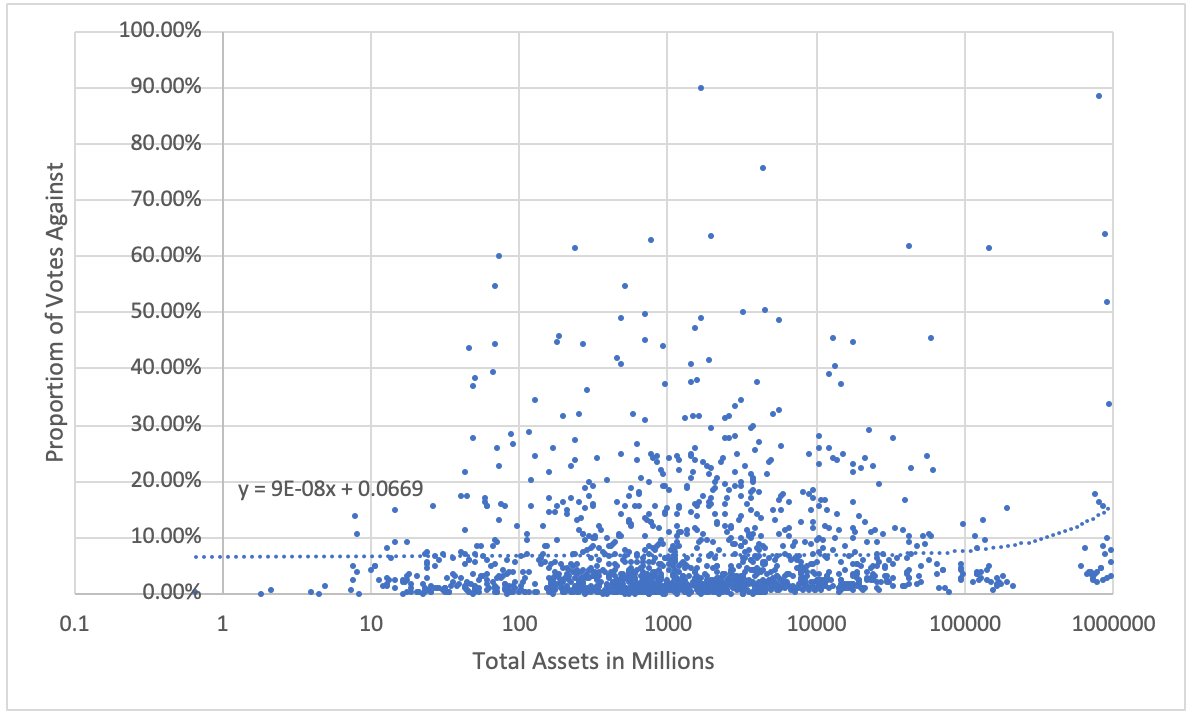
Figure 3: Total Assets & Votes Against Remuneration Report
Therefore, the impact of Total Assets on the equation representing the trendline is statistically significant .
Yearly Trends
Year based effects were shown to be insignificant in every case. Therefore, there is no generalized trend overtime to make votes against the remuneration reports more or less common that cannot be explained by the other factors that are included. This reinforces the importance of annual TSR and total assets in the vote on the remuneration report.
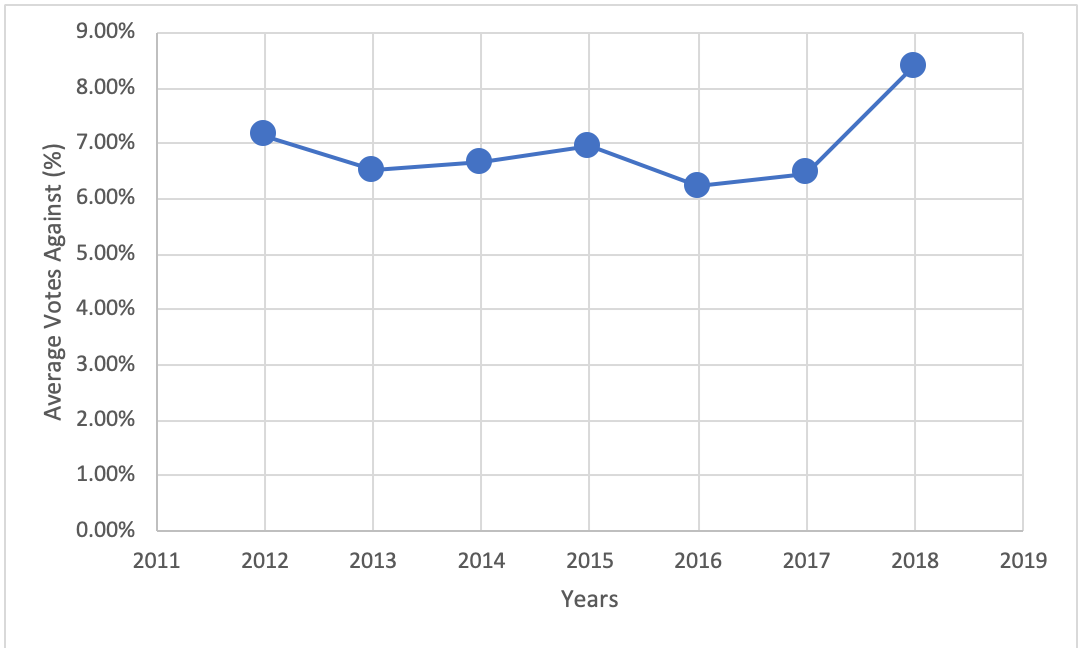
Figure 4: Yearly Average Votes Against Remuneration Report
As can be seen the average votes against stay relatively stable with a sharp uptick in 2018.
Companies that have their financial year ending in December have not been included in the 2018 data. This may create some skews in the 2018 data that are unavoidable at this point in time.
Overall, the findings are consistent over time.
Conclusion
Poor annual TSR is correlated with higher remuneration report “no” votes. Good TSR is correlated with less remuneration report “no” votes.
Good financial performance does not seem to matter relative to other measures when it comes to remuneration report votes.
A larger company will have more difficulty minimising the number of votes against their remuneration report than smaller companies.
Note that correlation is not causation. But what’s the bet?
Methodology
To analyse the effect of Total Shareholder Return (TSR) on pay voting outcome, we considered companies in the S&P/ASX300. Voting outcomes were sourced from Bloomberg and relevant disclosures. We only examined companies that held AGM to vote for the adoption of remuneration reports between 2012 and 2018, which reduced total observations to 1557.
We calculated the percentage of votes against the remuneration report, and over a one-year period prior to the AGM date for each company before running the following regression:
Votes_Againsti = α + Β1*TSRi + Β2*Total Assetsi + Β3*ROEi + B4*2013 + B5*2014 + B6*2015 + B7*2016 + B8*2017 + B9*2018 + εi
i = 1,…, N
where Votes_Againsti and annual TSR were the percentage of votes against the remuneration report and one-year total shareholder return up to the AGM date. Assetsi was Total Assets and ROEi was Return on Equity of the ith company respectively, with N = 1557 observations. The years within the equation serve as dummy variables and refer to the year ending of the remuneration report.
© Guerdon Associates 2025 Back to all articles


