
 Subscribe to newsletter

2015 CEO pay – a stronger link with performance
08/02/2016


This article looks at the changes in remuneration for ASX listed company incumbent CEOs from 2014 to 2015.
In summary, 35% of CEOs received no increase in fixed remuneration. Overall trends suggest that increases in fixed pay and short-term incentives (STIs) are modest but long-term incentives (LTIs) are increasing in value.
At 3.5%, the median increase in fixed pay is similar to the 3.3% increase we reported for 2014. The 56% of CEOs receiving an increase was higher than the 51% in 2014.
The median increase in total remuneration was 6.4%, similar to the 6.1% reported in 2014 and consistently higher than the 2.8% reported for 2013. 59% of CEOs received an increase in total remuneration, but 27% suffered a reduction. There was a decrease in the occurrence of STIs and an increase in both the occurrence and the size of LTIs.
Reductions in total remuneration (TR) were primarily attributable to a reduction in both the frequency and size of short-term incentives (STIs) and the reduction in the size of long-term incentives (LTIs). Increases in TR were mainly attributable to increases in the size and frequency of both STIs and LTIs.
Overall, increases in total remuneration appear to be related to the shareholder return (TSR) performance of companies. The average 2-year TSR of companies with CEOs whose total remuneration decreased was -11%, compared with 41% for companies with CEOs whose total remuneration increased.
Larger companies tended to constrain CEO fixed remuneration and provide modest increases to performance-based awards, with increases in LTI more likely. Smaller company CEOs were more likely to experience a decrease in STI frequency and size.
The increase in LTIs may be related to both the constraints on fixed pay movements and the preference of investors to see rewards linked to longer-term returns.
The sample
We analysed the change in remuneration between the 2014 and 2015 disclosures for the 135 individuals who occupied the same ASX 300 CEO position in 2015 as in 2014. The number of CEOs included in the analysis is less than 300 because the CEO had to be in the same position for the full two years while the company remained in the ASX 300 for the same period. Additionally, FYE 31 December 2015 disclosures are not yet available so these companies have been excluded. More than 25% of the ASX 300 CEOs were not in this position in the prior year. In effect, this study measures the reward changes to survivors. Hence, it may reflect a slight bias to better performers, as some of the CEOs who turned over did so because of performance issues. The sample has not been diluted with data from relatively new incumbents, who are often internal promotions, and who start at levels of pay lower than their predecessor. Data is current to December 31 and was sourced from GuerdonData®.
Companies were grouped using two criteria. The first was company size and the second was the Global Industry Classification System (GICS) sector. Company size was defined using a 30-day average market capitalisation as at 6 January 2016, and the companies were grouped into quartiles according to size.
Tables 1 and 2 summarise the segmentation. There are 34 companies in each size-based quartile group, apart from Q1, which has 33.
Table 1: Company size quartiles based on market capitalisation
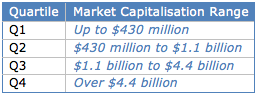
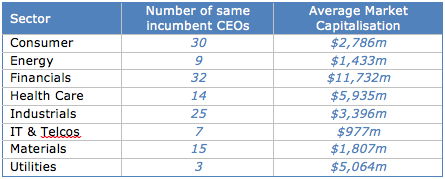
Table 2: Company industry sector
Change in Remuneration from 2014 to 2015
The median incumbent-weighted increases in total fixed remuneration (TFR) and TR are 3.3% and 6.1%, respectively. This represents consistent rates of TFR increase, but a higher rate of increase in TR than our 2014 results of 3.3 and 6.1% and 2013 results of 3.3% and 2.8%, respectively.
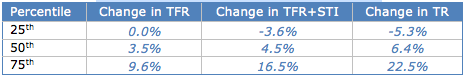
Table 3 summarises the incumbent-weighted increases in CEO remuneration between 2014 and 2015.
Table 3: Incumbent-weighted increases
Overall, 59% of CEOs received an increase in TR. For these CEOs, the median same-incumbent increase in TR was 19.3%. The overall (remuneration weighted) average increase in TR was 24%, of which 13% was attributable to increases in TFR. The remainder of the increase was attributable to increases in STI (33%) and LTI (54%). The median increase in STI was 14% and the frequency of STI payments increased from 84% to 89%. The median increase in LTIs was 37% and the frequency of LTI awards increased from 81% to 91%.
For the CEOs whose TR fell, the median reduction was 15%. The median change in TFR was an increase of 2.1%. The drop in TR is primarily attributable to reductions in performance pay, with LTI accounting for 31% and STI for 69% of the reduction. The frequency of STI payments within this group decreased from 81% in 2014 to 59% in 2015, with a median reduction in STI of 60%. The frequency of LTI payments within this group decreased from 86% in 2014 to 84% in 2015, with a median reduction in LTI of 32%.
The 13% of CEOs whose TR was unchanged from 2014 to 2015 experienced no increase in TFR and no substantive change in STI or LTI.
56% of CEOs received an increase in fixed remuneration in 2015, which is up from the 51% in our 2014 findings. Fixed remuneration decreased for 10% of CEOs and did not change for the remaining 35%.
CEO STIs were more likely to increase (45%) than they were to decrease (34%). LTIs were significantly more likely to increase (51%) than decrease (27%).
The proportion of CEOs whose remuneration increased, decreased or stayed the same is shown in Figure 1. CEOs who did not receive STI or LTI in either year are included in the “Stayed the same – zero” category.
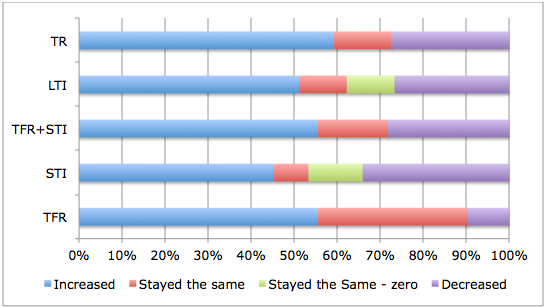
Figure 1: Percentage of CEOs whose remuneration increased, decreased or stayed the same
Does company size make a difference?
The largest companies awarded the smallest change in remuneration from 2014 to 2015.
Figure 2 shows actual TFR for both 2014 and 2015 (the log of market capitalisation is used to make the graph more readable) and confirms that TFR tends to have a direct and positive correlation to company size.
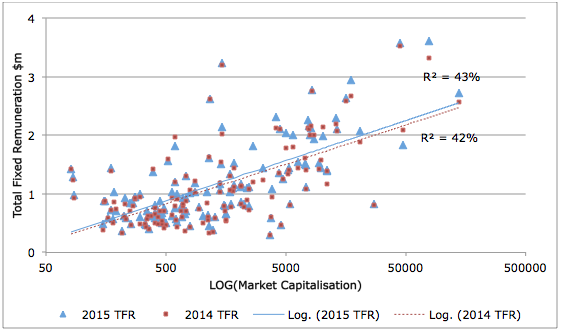
Figure 2: 2015 and 2014 fixed remuneration by company size
Table 4 summarises the median incumbent-weighted increases by company size groupings.
Table 4: Incumbent-weighted median increases by company size
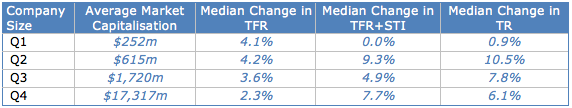
The CEOs of the largest companies (Q4) experienced the smallest percentage change in TFR. The frequency of incentive awards was similar for both years, however, there was a significant increase in the size of LTI awards. The median same-incumbent increase in LTIs was 16%. LTIs make up a steadily increasing proportion of pay for these CEOs, generally at the expense of fixed pay.
The CEOs of the smallest size group (Q1) experienced a decrease in the size of STIs, which is a reversal of our 2014 findings, with a median decrease of 12%. The frequency of STIs has decreased from 79% to 64%. Fixed remuneration and LTI increases have more than compensated for the reduction in STI payments, resulting in a median TR increase of 0.9%. This is related to the increased representation of resources companies that have been adversely affected by reductions in commodity prices.
The largest increase in TR (10.5%) related to the Q2 group (second smallest) companies. All aspects of remuneration increased on average, but the most significant was the increase in both the size and frequency of LTI awards.
Variations across Sectors
There is significant variation in median pay increases across the various GICS sectors. Table 5 summarises median incumbent-weighted increases by sector.
Table 5: Incumbent-weighted median increases by company sector
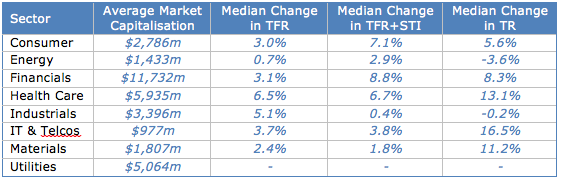
The Energy sector has been experienced the lowest median change in fixed remuneration and the median change in total remuneration is negative. We would expect this outcome given the impact of lower commodity prices on earnings outcomes.
The Healthcare sector produced the largest median increase in fixed remuneration, although it was lower than the median 8.9% in 2014. More than half of the increase in total remuneration is attributable to increased LTIs.
The Industrials sector experienced a significant reduction in frequency and size of STIs, although increased fixed remuneration and LTIs have gone some way to offset the impact.
The IT and telcommunications sector experienced the largest increase in total remuneration. All aspects of remuneration increased, but LTIs accounted for half of the overall increase. The Materials sector also experienced a large increase in total remuneration due to increased frequency and size of LTIs.
With only three companies, trend statistics could not be calculated for the Utilities sector.
Most sectors show an increase in the frequency of incentive payments. STIs increased in the Finance and Healthcare sectors and decreased in the Materials and the Consumer sectors. LTIs increased significantly in the IT, Finance and Consumer sectors. No sector experienced a decrease in overall LTI awards.
Relationship with performance
Overall, increases in total remuneration appear to be related to the level of shareholder returns. Table 6 shows the average 2-year total shareholder return and ROE for the CEOs whose remuneration went down, up or stayed the same.
Table 6: Incumbent-weighted median increases and annual performance
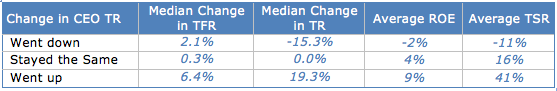
Our analysis suggests that the relationship between changes to total remuneration and changes in company performance has strengthened over time.
Notes on methodology
CEOs were excluded if:
- Their remuneration was most recently disclosed prior to January 2015
- They were not in the CEO position for the whole of the past two financial years
- Their company was not in the ASX 300 as at 1 January 2016
The following abbreviations are used in this document:
- TFR: Total Fixed Remuneration including salary, fringe benefits and superannuation
- STI: Short Term Incentives, which is pay contingent on performance measured within a 12 month period
- LTI: Long term Incentives, which is pay contingent on performance over a period greater than 12 months (typically 3 or more years)
- TR: Total Remuneration, which is the sum of the above.
Guerdon Associates applies a rigorous and consistent definition of STIs and LTIs throughout our analysis. Therefore our results will be different from analyses reported in the media that have assumed that all equity compensation is long term, or that company definitions of ‘long-term’ are consistent across the ASX 300. Both these assumptions are incorrect. We have also treated negative accounting values disclosed for equity grants as zero, rather than as genuinely reducing the CEO’s remuneration, to avoid nonsense situations where a CEO with fixed pay of, say, $1 million has ‘total remuneration’ of $800,000 because there is a negative $200,000 equity value disclosed.
To qualify as a LTI, an award must be performance-hurdled (to provide the incentive) with a performance period longer than 12 months (to be considered long-term). Therefore, time-vested grants of equity and retention incentives are deemed not to be at risk (i.e. not variable with performance). Additionally, incentives with just a 12-month performance period are deemed to be STIs, even if the award is deferred for a longer period.
In 2015, there were very few instances of un-hurdled equity. One-off grants such as sign-on arrangement and IPO grants have been excluded from the analysis. Regular equity awards that form part of guaranteed pay are included in TFR.
Very small increases in fixed remuneration (less than 2.9%) are assumed to be due to variations in payroll timing or statutory FBT expenses. These are included in aggregated statistics, but when calculating the proportion of CEOs whose remuneration increased, these are assumed to have “stayed the same”.
There are two ways of estimating the change in remuneration over time. One is to analyse the individual percentage change in remuneration (incumbent-weighted) and the other is to analyse the change in aggregated statistics, like sum or average, (remuneration-weighted). In the first case, the change in remuneration for each CEO has equal weighting in the analysis. In the second, the changes in the remuneration of highly paid CEOs will have a stronger influence on the outcomes than the same remuneration change in a lower paid CEO. Unless stated otherwise, we have used the incumbent-weighted method in our analysis.
© Guerdon Associates 2026
 Back to all articles


