10/06/2016
Australian based employees appear to hold on to shares received via an employer share plans than most other countries employees, including the US and UK. This supports the view that employee equity ownership plans can provide a reward vehicle that serves to attract and retain Australian employees more effectively than most other countries. With additional limitations being imposed on superannuation announced by both sides of politics, the allure of effective employee equity plans as a tax effective savings vehicle is likely to increase.
Fidelity Investments, A US headquartered financial institution with more than $2 trillion under management, has released the results of its global study of employee behaviour across multiple dimensions and attributes of employee share scheme design. See HERE.
The purpose of Fidelity’s study was to help its employer clients understand employee behavior specific to employee share purchase plans (ESPP). These plans are the most common way to introduce broad-based equity ownership with employees. In Australia, the $1,000 tax exempt plan, the salary sacrifice plans and discount share purchase plans would all be regarded as ESPPs. Australia was one of the countries in Fidelity’s survey.
Fidelity analysed data from more than 330,000 employees who completed share purchases in 2012 under ESPPs. The study measured employee behavior as of December 2014 and classified the employees across:
- Holders: employees who held onto all shares purchased in 2012
- Partial: employees who held a portion of shares purchased in 2012, and sold a portion of shares; and
- Sellers: employees who sold all shares purchased in 2012
Employers are best able to evaluate if the objectives of their employee share programs are being met when they understand employee behaviour and the relationship between plan design and behaviour.
Fidelity’s study found that the discount on purchase was the biggest driver of employee participation and behaviour. Consequently, the Fidelity analysis used discount as the primary element of plan design to demonstrate differences in participant behaviour.
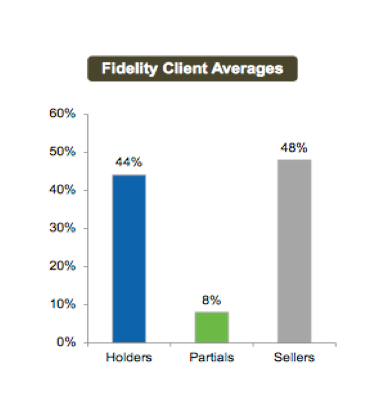
The following graph shows the overall behavior of more than 330,000 employees across approximately 105 employers that are clients of Fidelity. The most significant finding is that 44% of employees continued to hold their shares 2.5 years after purchaseThe analysis found a direct relationship between age and the propensity to hold shares. Employee participants are more likely to be holders as age increases, with the highest proportion of holders in the 60+ age group. While the overall average percentage of holders was 44% (see graph above), 58% of the employee population that were aged 60+ were holders.
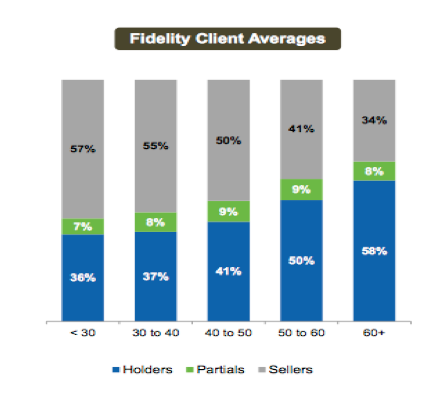
The analysis found a direct relationship between age and the propensity to hold shares. Employee participants are more likely to be holders as age increases, with the highest proportion of holders in the 60+ age group. While the overall average percentage of holders was 44% (see graph above), 58% of the employee population that were aged 60+ were holders.
Employees participating in ESPPs with a discount demonstrated a greater likelihood to hold shares as their age increases suggesting that older participants potentially view ESPPs as a vehicle in saving for retirement.
The analysis found employees more likely to be holders as the tenure increases beyond 15 years, with the highest proportion of holders in the 25+ year tenure segment. Tenure did not seem to have as significant an impact as age.
Employees across the population with 25+ years in tenure are also more likely to be over 50, indicating age is potentially playing a bigger role in influencing holding behaviour than tenure.
Implications of the purchase value
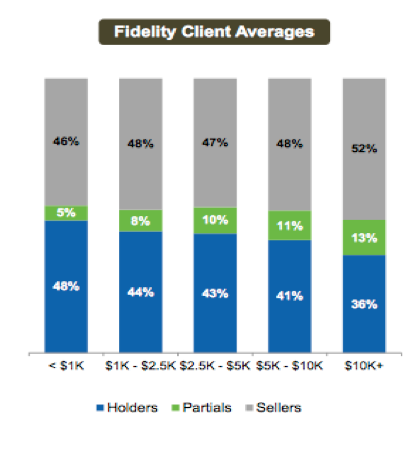
The graph below shows that the greater the initial purchase value, the lower propensity to hold the shares.
The purchase value is the aggregate annual value of contributions made by participants to purchase shares (in 2012) and does not include value associated with a discount, lookback, or company match.
The graphs also show that employees with lower purchase amounts are more likely to be holders.
The proportion of holders declines steadily as the purchase value increases.
The proportion of partials increases with value implying that employees who invest more in ESPPs are more likely to sell a portion of their shares.
Behaviour by location and discount
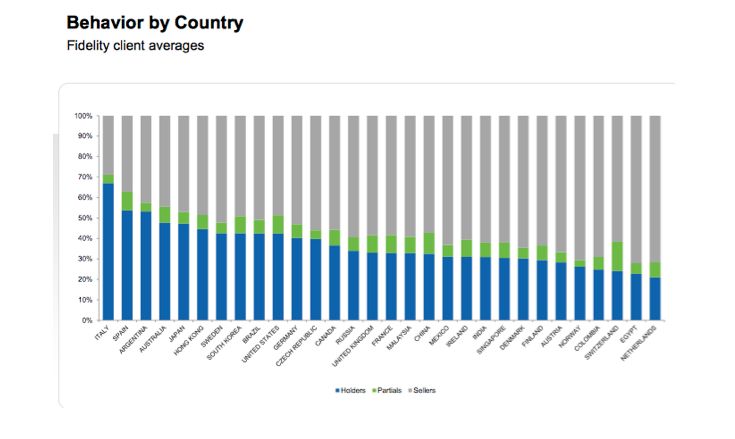
The following graph shows the implications on behavior of location and location and discount.
It is relevant to note that the measure of discount across the plans was in the range of 0% to 15% and greater than 15%.
Notwithstanding the above finding that 35% of employees outside the US are holders, circa 47% of the employee population in Australia were found to be holders. This is not surprising given that this would capture the $1,000 tax exempt plan and salary sacrifice plans.
In his presentation to the Employee Ownership Australia (EOA) group in May 2016, David Thodey explained that notwithstanding the Telstra shares were costing the employees nothing, there was still less than 70% of Telstra employees who were shareholders when he became CEO in 2009. He went on to say that he focused on communicating the benefits of share ownership and was able to increase that employee shareholding to more than 90% by the time he finished at Telstra.
He is a strong advocate of employee share ownership and was reported as saying “I have no definitive proof that it made anyone work harder or be more innovative, but I do know it gave our people more understanding and sense of responsibility for what was going on in the company,” he said. “In my view, it’s a win-win.”
Guerdon Associates, along with other professional advisers and employers, has lobbied the current and former governments over many years for improved tax effectivenness. While the lack of movement on this aspect of employee share plans is said to be a matter of revenue loss, that view fails to recognise the significant benefits and potential for increased revenue that can flow from increased employee share ownership.
© Guerdon Associates 2024 Back to all articles


 Subscribe to newsletter


