
 Subscribe to newsletter

ASX 300 FY 2018 CEO Remuneration Increases
08/02/2019


Our annual remuneration review of same incumbent Chief Executive Officers (CEOs) and Managing Directors (MDs) who led ASX 300 companies through both the 2017 and 2018 reporting periods reveals modest fixed pay increases overall for about 60% of CEOs.
To summarise, almost 40% of CEOs did not receive any increase in fixed pay, almost 43% saw a decline in annual incentive, while LTIs were higher.
Where there was an increase, fixed pay and total remuneration saw median increases of 2.3% and 4.9% respectively.
Short-term incentives (STIs) and long-term incentives (LTIs) saw median increases of 2.47% and 16.0%, respectively. The compares to the median increase in total shareholder return (TSR) was 18.91% over the same period.
Total remuneration saw a median increase 4.9%.
Fixed and total remuneration saw average increases of 4.83% and 10.24%. Alongside this was an average increase in TSR of 23.46%.
On a sector basis fixed remuneration appeared driven by supply and demand.
Overview
One hundred and eighty-one ASX 300 CEOs survived to provide service for 2 full years. This was the ASX 300 CEO population on which the analysis was conducted. Remuneration data was sourced from GuerdonData®, and TSR date from Bloomberg®.
The median change in total fixed remuneration (TFR) in FY 18 was an increase of 2.3%, up from 2.0% in our previous analysis for the 2016-2017 period. Total remuneration increased by 4.9%. This is the lowest annual increase for some time, as can be seen in Figure 1 below.
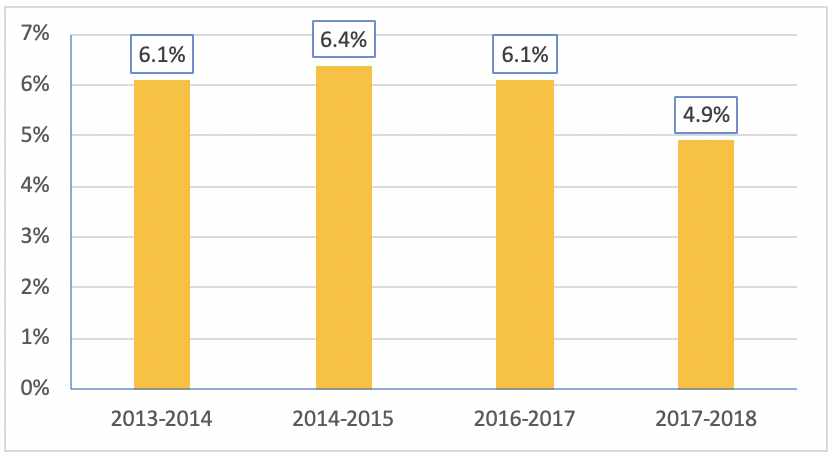
Figure 1: Total remuneration changes from previous analyses
This slowdown on the increase of total remuneration can be attributed to the LTIs, which did not increase as much, i.e. from 18.2% to 16.0%. Note that the LTI data is derived from statutory disclosures, which includes the amortised value of share-based payments expense when LTIs are delivered as rights, options, SARs, loan shares, cash, or restricted shares, and are contingent on performance for a period greater than 12 months.
For STIs, the median increase changed from 0% to 2.47%.
From Figure 2, we can see that TFR and STIs were largely unchanged in absolute monetary terms, while LTIs increased across the board.
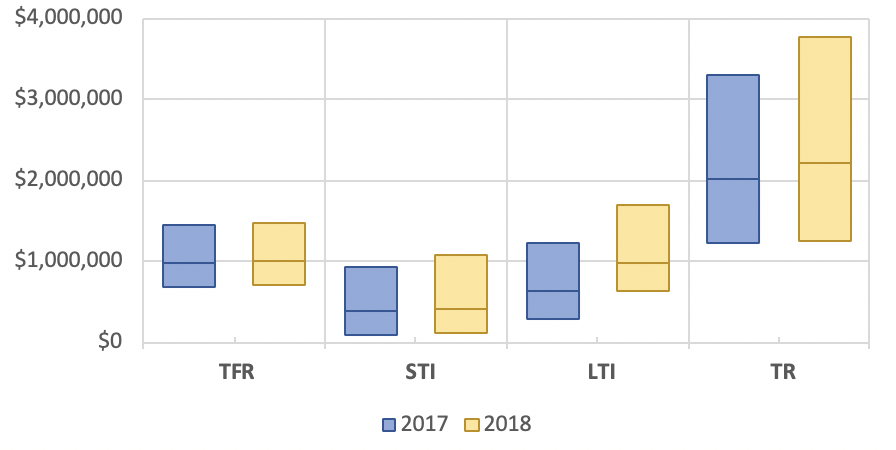
Figure 2: Box plot of absolute yearly remuneration by compensation component
From Figure 2, we can see that TFR and STIs were largely unchanged in absolute monetary terms, while LTIs increased across the board.
Total remuneration remained steady for low to mid end CEOs, while the top end saw a significant increase in absolute monetary terms.
By Company Size
We segmented companies into quartiles based on their 30-day average market capitalisation, taken on the 30th September 2018.
Table 1: Median of % change in remuneration and TSR by market capitalisation quartiles.
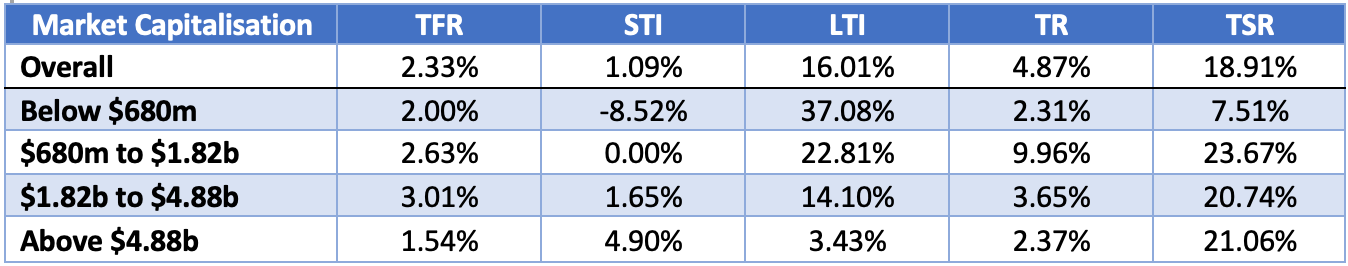
From this analysis, three interesting trends have emerged:
1 . As market capitalisation has increased, the median rate of change in LTIs has decreased;
2 . As market capitalisation has increased, the median rate of change in STIs has increased.
3 . It was a stunning year for TSR .
The decrease in LTIs stems from small companies that start with low LTI amounts. The year on year increases of LTIs in dollar amounts will be small but on a proportional percentage change basis, they are larger.
By Sector
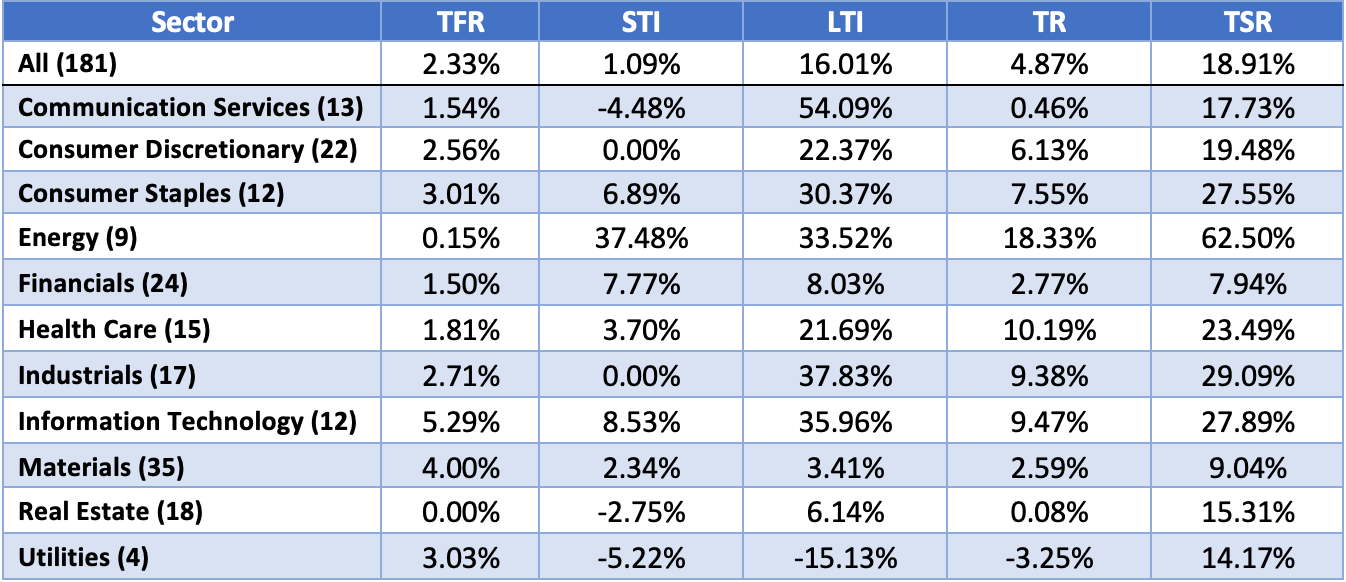
We classified each company in our sample according to their (GICS) sector. Figure 3 shows the change in remuneration across the different sectors:
Table 2: GICS sector breakdown of median change in TFR, STI, LTI, TR and TSR
Note that over the 2018 financial year, GICS experienced significant changes to its sector classifications:
1 . The Telecommunication Services sector was broadened and renamed as Communication Services;
2 . Media companies such as Nine Entertainment (ASX: NEC) and SKY Network Television (ASX: SKT) were moved from Consumer Discretionary to Communication Services;
3 . Internet media platform companies such as Carsales.com (ASX: CAR) and REA Group (ASX: REA) were moved from Information Technology to Communication Services and
4 . E-commerce companies were moved from Information Technology to Consumer Discretionary.
Overall, on a sector basis fixed remuneration appeared driven by supply and demand.
The Information Technology sector received the highest change in median sector TFR of 5.29%.
Real Estate saw fixed and total remuneration changing by less than 0.1%. Compared to the previous analysis where they changed by 2% and 12.6% respectively.
The Energy sector received the largest sector median total remuneration increase of 18.33%. This was driven primarily by incentive increases of 37.48% and 33.52% in STIs and LTIs. Noticeably, fixed remuneration (see Figure 3) changed by 0.15% which reflects how increases in remuneration tend to come from the variable remuneration components.
After receiving the largest change in median fixed remuneration of 11.4% in the previous analysis, the Utilities sector has fallen to the middle with a 3.03% change. Furthermore, Utilities median total remuneration fell by 3.25% which was caused by STIs and LTIs falling by 5.22% and 15.13% respectively. However, the sample size is small (4). Furthermore, Ausnet Service Ltd (ASX:AST) and AGL Energy Ltd (ASX:AGL) CEOs had LTIs fall by 30% and 56% respectively.
The Communication Services had the largest median sector increase in LTIs of 50.77%. More than half of the sector experienced an increase in LTIs of greater than 40% It may be that more Communications’ CEOs were granted LTIs in FY2018. They also experienced an increase in STIs of 3.97% and fixed remuneration by 1.54%, while total remuneration only changed by 0.46%.
In a year that saw the beginning of the Hayne Royal Commission, Financials’ CEO STIs had a median sector increase of 11.87%, although total remuneration increased less at 1.65%.
Market changes
For the third part of our analysis, we looked at the directional changes of each remuneration component. We proportioned the sample by the number of CEOs who experienced an increase or decrease greater than 1% or a change within 1%.

Figure 3: Changes by component of pay
Over half (59.7%) of the sample received an increase in fixed remuneration while an additional 24.9% saw a change within 1%. So, effectively about 40% of CEOs did not receive an increase.
For STIs, 42.9% of the companies saw a decrease, compared to last year’s 36%. Managers may be having difficulties in meeting their key performance indicators (KPIs) or remuneration board committees are setting more demanding targets.
Regardless, variable pay appears to be just that, with managers being almost as likely to receive an increase or decrease in their annual incentives.
Nevertheless, LTIs went the other way, with 65.2% experiencing an increase in their LTI, up from last year’s 58%. Note that statutory LTI values are fair values based on accounting standards and an increase can be attributed to strong long-term earnings per share performances.
Overall, almost 60% of the market saw an increase in their total remuneration. Similar to our previous analysis, companies are continuing to see an increase in their LTI at the expense of their STI.
Market averages
Finally, we utilised different weighted averages to analyse the changes in remuneration components. This was done to eliminate outliers and biases resulting from large percentage changes on small monetary values.
The average remuneration changes were analysed in three ways:
1 . An incumbent weighted average where each individual’s change in remuneration elements is weighted equally.
2 . A total remuneration weighted average where the weights are the average incumbents’ 2 years of total remuneration for 2017-2018 over the sum of all 181 CEOs’ two year average total remunerations. This method puts a higher weighting on individuals who receive higher overall remuneration.
3 . A remuneration component weighted average where the weights are the average two year incumbent remuneration component (TFR, STI or LTI) over the sum of all 181 CEOs’ two year averages for that remuneration component. This process is to see the impact of the remuneration components more clearly. (Note using the TR component here yields the same results as the total remuneration weighted average.)
Table 3: Full sample equally weighted incumbent changes.
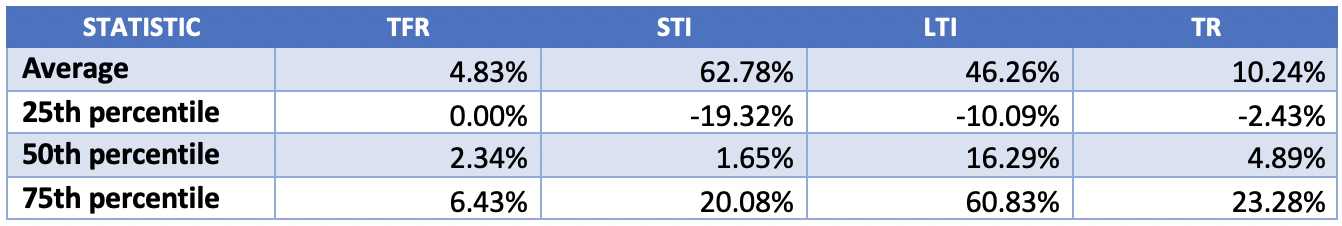
While the percentile rankings are indicative of the whole sample, the averages are skewed by large percentage changes on small amounts. The following figure further explains this phenomenon.
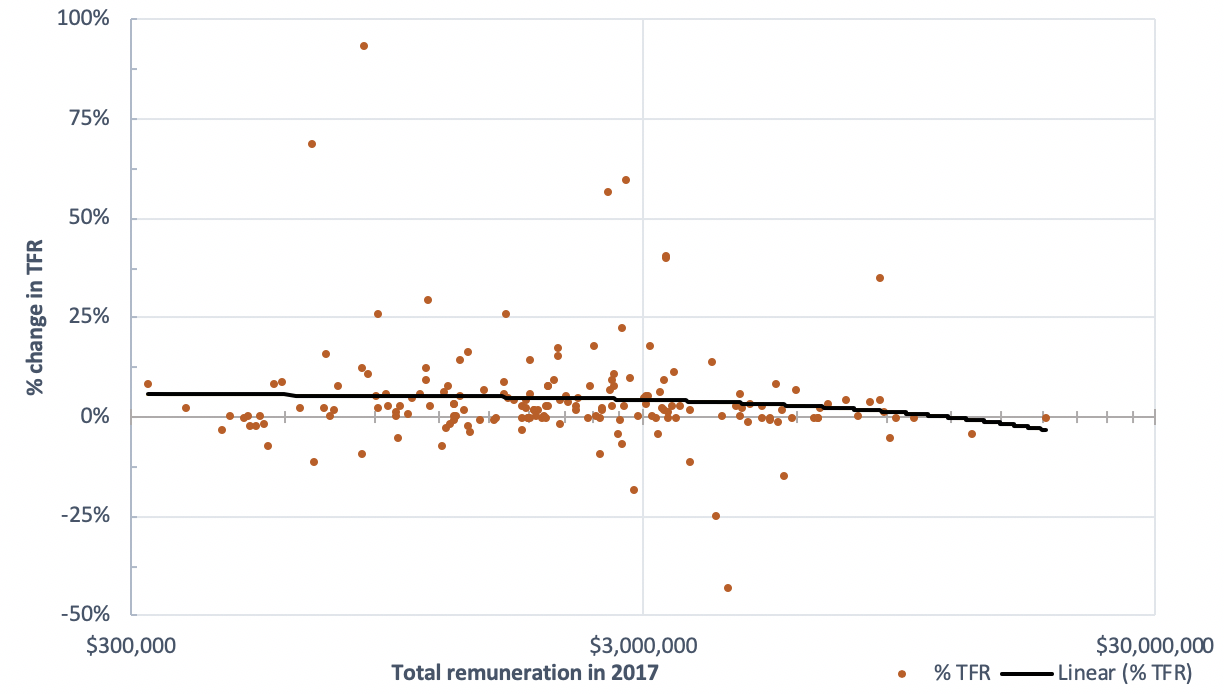
Figure 4: Percentage change in TFR by total remuneration in 2017
Figure 4 shows that lower paid CEOs are much more likely to experience high percentage changes in their remuneration.
As such, the incumbent weighted approach is skewed by lower paid CEOs because they experience higher percentage changes. Therefore, using the average total remuneration as weights should provide a more valid figure of the overall market change , accounting for this.
Table 4: Incumbent weighted and total remuneration weighted average percentage changes
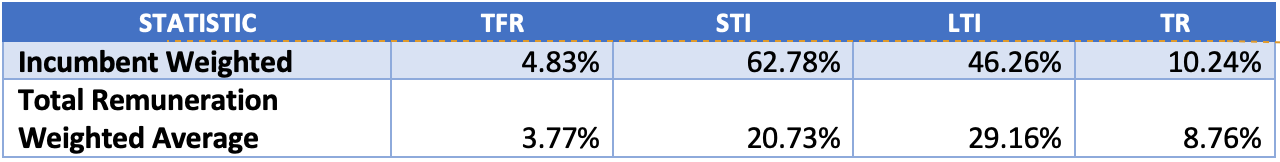
Table 4 gives the incumbent weighted and total remuneration weighted averages. The total remuneration weighted average provides a measure of the overall change which is more robust to individual variability in levels of remuneration.
These remuneration weighted averages are less than the averages in the equally weighted figures across the board. This reinforces the findings of figure 6, that higher paid CEOs had smaller proportional changes across all remuneration components than lower paid CEOs.
We decided to use a remuneration component weighted average as a better indicator of how individual remuneration components changed over the year. This is because within each company, there are differences in their remuneration policy with some companies paying high fixed remuneration at the expense of STI or LTI.
Note this approach can be distorted as STI and LTI components are highly variable. Large one-off figures from performance incentives and revaluation of long-term equity grants will have a much larger influence within this measure compared to using a more robust figure such as total remuneration.
Table 5 provides all three methods of our weighted average calculations.
Table 5: Incumbent weighted, total remuneration weighted and remuneration component weighted average percentage changes.

The remuneration component weighted averages provide a more valid depiction of the increases as it accounts for the different mixes of TFR, STI and LTI.
Using this approach, we see an average increase in fixed remuneration of 4.01%.
STIs and LTIs increased by 3.19% and 3.91% respectively, which indicates that CEOs with high STI and LTI figures only saw a small increase in these components.
Finally, TR increased by 8.76% (which is identical to the total remuneration-weighted average as the calculation approach is equivalent.)
Methodology notes
The population of ASX300 listed companies was taken just after the September 2018 S&P ASX300 index rebalancing. Remuneration figures for the executives corresponding to these companies were subsequently obtained from GuerdonData®, a database of remuneration information sourced from the statutory disclosures present in company annual reports.
Companies with financial years ending in December or that are yet to disclose their 2018 annual reports at the time of analysis were removed from the sample. Similarly, companies that listed on the ASX during 2017 or 2018 were removed, since they have no remuneration disclosures available prior to their listing. Finally, companies which lacked statutory disclosures for other reasons were also removed.
Since our analysis spanned two reporting periods, it was required that the executives in question held their position for the entire two-year timeframe. Executives who changed position or served a part-year term were excluded from the analysis. Additionally, executives terminating at the end of the two reporting periods had their termination benefits removed to avoid skewing their remuneration amount.
Disclaimers:
The averages for the incumbent weighted changes are affected by outliers.
The segmenting of results into multiple sectors is limited as the small sample sizes introduces large variability in the observed values.
For the STI and LTI figures, large changes in incentive levels themselves adds to the year on year variability.
Some results may be reflective of data-mining effects rather than underlying causal factors, due to the limited sample size of 181.
The sample reduction itself is a source of bias. Relying on the ASX300 at a particular point in time excludes companies which have previously fallen out from the index and replacing them with recent additions. This may cause a positive bias if there is a correlation between share price performance and remuneration or market capitalisation and remuneration
The following abbreviations have been used:
- TFR: Total fixed remuneration including cash salary, fringe benefits and superannuation
- STI: Short term incentives, which is pay contingent on performance measured within a 12-month period.
- LTI: Long term incentives, which is pay contingent on performance over a period greater than 12 months (typically 3 or more years.)
- TR: Total remuneration, which is the sum of the above
 Back to all articles


