
 Subscribe to newsletter

CEO remuneration changes, 2016 to 2017 – pay stagnated just like regular people’s pay
12/02/2018


This article examines changes in statutory remuneration for same incumbent Chief Executive Officers (CEOs) and Managing Directors (MDs) who led ASX300 companies during both the 2016 and 2017 reporting periods.
In a nutshell, fixed pay hardly moved, as many received more annual incentive as lost it, and LTIs magically increased probably because the accountants reflected a good financial year into a greater likelihood that something will vest.
After exclusions (see methodology appendix) we examined the remuneration changes for the full sample of 173 company executives who survived two full years, and subsets segmented by GICS sector and company size.
Within the entire sample, the median change in total fixed remuneration (TFR) was 2.0%, while the median change in total remuneration (TR) was 6.1%. In our last equivalent analyses (for the 2014-2015 period), the median change in fixed remuneration was 3.5% and the median change in total remuneration 6.4%. Further back, for the 2013-2014 period the median change in fixed remuneration was 3.3%, and the median change in total remuneration 6.1%. This indicates that year-on-year changes in total remuneration are relatively stable, while year-on-year changes in fixed remuneration have reduced.
Total remuneration increased at a greater rate in 2016-2017 than fixed remuneration, predominantly due to increases in statutory long term incentives (LTI) expense. The median long term incentive increase was 18.2%.
The median change in short term incentive was zero.
In a symmetrical result rarely seen, the 25th and 75th percentile for the change in STI were evenly placed around zero. The former was a reduction in STI of 29% while the latter an increase of 29%.
For comparison, the 25th percentile change in LTI was -11% while the 75th percentile change was 82%.
The LTI result is not likely to be indicative of grant level increases or increases in take home pay. Long term incentives values reported in statutory accounts are a fair value based on accounting standards, and reflect discounts for the probability of vesting in either the fair value of the instrument, or the number expected to vest, and are an amalgamation of multiple years of grants amortised over their performance period.
(It is possible to have negative LTI values. This is why Guerdon Associates uses an alternative methodology to benchmark LTI values in client work rather than benchmarking statutory figures.)
A bit over half (58%) of the sample received an increase in fixed remuneration. A bit less than half of the sample saw no change or went backwards in fixed remuneration (i.e. 28% of the sample experienced only small or zero changes in fixed remuneration with less than 1% change in either direction. 13% saw reduced fixed remuneration.)
For levels of short term incentive, 46% reported increases and 36% reported decreases. For long term incentives, 58% reported increases and 27% reported decreases.
Just above 60% of the sample experienced an increase in total remuneration and 30% experienced a decrease.
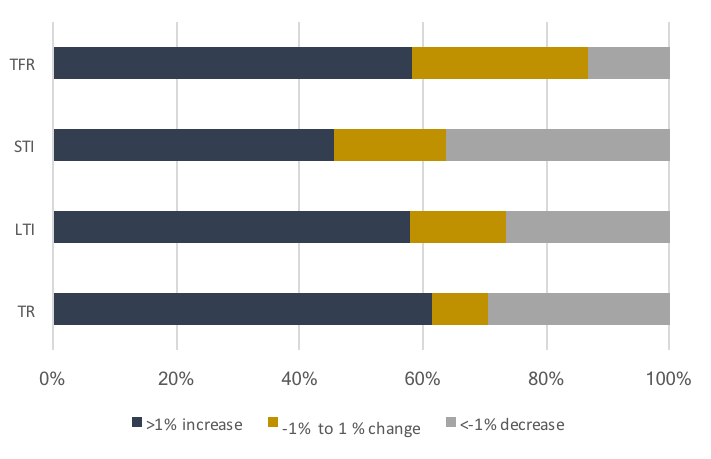
Figure 1: Changes by component of pay
The largest companies experienced the lowest median increases in fixed remuneration, no change in median short term incentives and the lowest median change in total remuneration.
Table 1: Median of incumbent-weighted changes by market capitalisation quartiles
| Market Cap quartile | Market capitalisation range | Median TFR change % | Median STI change % | Median LTI change % | Median TR change % |
| Q1 | Up to $560 million | 2.9% | -8.1% | 25.4% | 5.3% |
| Q2 | $560 million to $1.47 billion | 2.1% | 6.4% | 23.0% | 8.5% |
| Q3 | $1.47 billion to $4.30 billion | 2.4% | 7.0% | 10.8% | 12.3% |
| Q4 | Over $4.30 billion | 0.9% | 0.0% | 15.5% | 3.1% |
Increases in remuneration varied across sectors substantially. In its crudest form pay increases follow other peoples’ money. It always has. That is, where capital flows increases executive demand, and exacerbates supply shortages, resulting in pay increases at all levels, and observed most clearly in KMP remuneration disclosures.
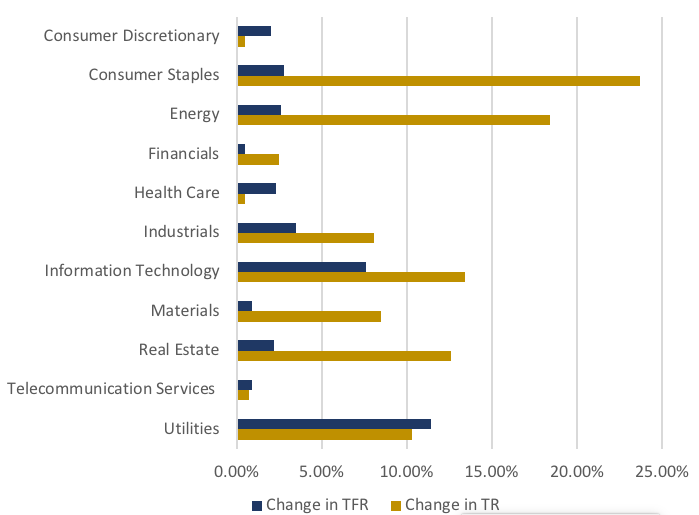
The utilities sector received the greatest change in median fixed remuneration (+11.4%) while the financial sector received the least (+0.5%). The information technology sector also received a high increase of (+7.2%) while the telecommunications and materials sectors received low increases of (+0.9).
For total remuneration, the consumer staples sector received the largest increase (+23.7%), followed by the energy (18.4%), information technology (13.4%) and real estate (12.6%) sectors, while the consumer discretionary and health care sectors received the least increase (+0.5%).
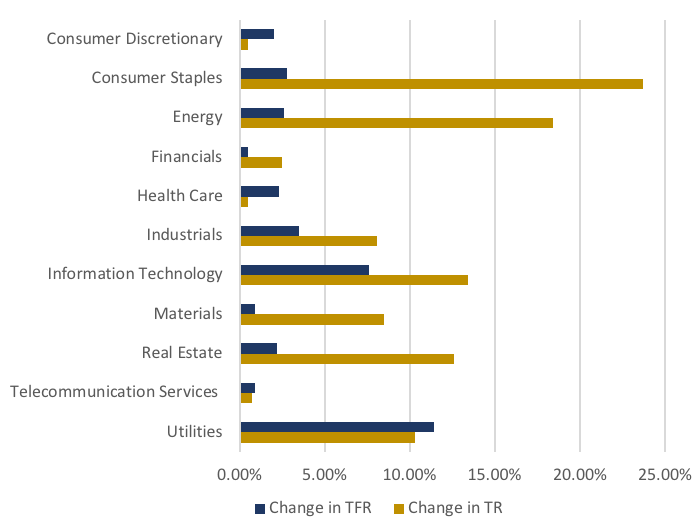
Figure 2: Change in fixed remuneration and total remuneration by GICS sector.
The following discusses each of the above elements in more detail.
S&P/ASX 300 same incumbent changes
Remuneration changes were analysed in two ways. The first was by the individual percentage change in remuneration (incumbent-weighted), and the second was by the change in aggregated statistics (remuneration-weighted). In the first case, the percentage change in remuneration for each executive has equal weighting. In the second case, the changes in the remuneration of highly paid executives have a stronger influence on the outcome.
Table 2 summarises the incumbent-weighted changes in CEO remuneration between 2017 and 2016. The incumbent-weighted changes show a median change in fixed remuneration of 2.0% and a median change in total remuneration of 6.1%. The averages of the incumbent-weighted changes; 6.6% for fixed remuneration and 16.1% for total remuneration; are larger than the corresponding median figures. This arises as a result of positive skew in the distribution of incumbent-weighted changes (i.e. higher paid individuals’ remuneration levels influence the averaged values).
Table 2: Full sample incumbent-weighted changes.
| Statistic | TFR change % | STI change
% |
LTI change
% |
TR change
% |
| Average | 6.6% | 18.8% | 48.9% | 16.1% |
| 25th percentile | 0.0% | -28.5% | -10.8% | -3.5% |
| 50th percentile | 2.0% | 0.0% | 18.2% | 6.1% |
| 75th percentile | 7.7% | 28.5% | 81.7% | 22.6% |
Table 3 gives percentage changes of remuneration-weighted averages. Examining the changes in these averages provides a measure which is more robust to individual variability in levels of remuneration. The figures of 4.3% and 15.0% for percentage change in average fixed remuneration and average total remuneration are both lower than the corresponding averages in the incumbent-weighted figures. This indicates that higher paid executives had smaller changes in fixed and total remuneration than lower paid executives.
Table 3: Percentage changes in full sample remuneration-weighted average.
| Average TFR change % | Average STI change % | Average LTI change % | Average TR change % |
| 4.3% | 4.4% | 28.7% | 15.0% |
The change in the remuneration-weighted average long term incentive (LTI) of 28.7% is more reflective of the true trend in long term incentive changes compared to the figure for incumbent-weighted average LTI change of 48.9%. The latter is predominantly due to large percentage increases among few individuals starting from a low level of long term incentive. But, even on a remuneration weighted basis, LTI increases are still high. To an extent, though, this may reflect an accountant’s view of how many share rights and options are likely to vest given company financials have markedly improved last year.
By company size
Company size was defined using a 30-day average market capitalisation as at 19th Sep 2017, and the companies were segmented into quartiles of company size.
Table 4: Company size quartiles based on market capitalisation.
| Quartile | Market capitalisation range | Average 1-year TSR to FYE 2016 | Average 1-year TSR to FYE 2017 |
| Q1 | Up to $560 million | 65.9% | 2.43% |
| Q2 | $560 million to $1.47 billion | 68.6% | 10.9% |
| Q3 | $1.47 billion to $4.30 billion | 36.4% | 17.6% |
| Q4 | Over $4.30 billion | 23.7% |
17.8% |
Table 5 provides the incumbent-weighted changes observed for each company size quartile. Executives of the largest companies (Q4) experienced the smallest percentage change in fixed and total remuneration. The changes in fixed remuneration were conservative in comparison to the changes in total remuneration across all quartiles of market capitalisation.
Table 5: Median of incumbent-weighted changes by market capitalisation quartiles.
| Market Cap quartile | Median TFR change % | Median STI change % | Median LTI change % | Median TR change % |
| Q1 | 2.9% | -8.1% | 25.4% | 5.3% |
| Q2 | 2.1% | 6.4% | 23.0% | 8.5% |
| Q3 | 2.4% | 7.0% | 10.8% | 12.3% |
| Q4 | 0.9% | 0.0% | 15.5% | 3.1% |
The averages for the incumbent weighted changes are affected by outliers. Remuneration-weighted averages are more indicative and are presented in Table 6. Remuneration-weighted averages increased across all market capitalisation quartiles. The smallest quartile of companies experienced a large increase in long term incentive and a large decrease in short term incentives.
Table 6: Changes in remuneration-weighted averages by market capitalisation quartile.
| Market Cap quartile | Average TFR % change | Average STI % change | Average LTI % change | Average TR % change |
| Q1 | 5.1% | -17.8% | 52.1% | 8.3% |
| Q2 | 0.5% | 9.6% | 31.5% | 9.1% |
| Q3 | 8.94% | 21.4% | 31.2% | 21.3% |
| Q4 | 3.0% | 0.7% | 20.8% | 11.4% |
By GICS sector
Remuneration changes were also examined by GICS sector. Table 7 gives the median incumbent-weighted changes in fixed and total remuneration.
The results across sectors vary substantially. The utilities sector received the greatest change in median fixed remuneration (+11.4%) while the financial sector received the least (+0.5%). For total remuneration, the consumer staples sector received the largest increase (+23.7%), while the consumer discretionary and health care sectors received the least increase (+0.5%).
The correlation between positive values of total shareholder return and remuneration changes is very weak. However negative total shareholder return in 2017 appears to be associated with small median changes in total remuneration. No sector experienced a decrease in median TFR change or median TR change.
Table 7: Breakdown of median fixed remuneration and median total remuneration changes by GICS sector. Sample size and average market capitalisation per sample are included for reference.
| Sector | Sample size | Average Market Cap | Average 2017-2016 TSR | Average 2016-2015 TSR | Median TFR change % | Median TR change % |
| Consumer Discretionary | 30 | $1.8B | -3.9% | 44.3% | 2.0% | 0.5% |
| Consumer Staples | 12 | $5.7B | 8.2% | 21.8% | 2.8% | 23.7% |
| Energy | 6 | $2.1B | 32.5% | 51.0% | 2.6% | 18.4% |
| Financials | 23 | $17.1B | 21.4% | 30.6% | 0.5% | 2.5% |
| Health Care | 14 | $6.5B | -9.9% | 36.8% | 2.3% | 0.5% |
| Industrials | 16 | $3.8B | 40.4% | 36.7% | 3.5% | 8.1% |
| Information Technology | 10 | $2.7B | 4.3% | 46.3% | 7.6% | 13.4% |
| Materials | 35 | $8.1B | 18.5% | 108.0% | 0.9% | 8.5% |
| Real Estate | 18 | $3.7B | 10.3% | 16.8% | 2.2% | 12.6% |
| Telecommunication Services | 5 | $11.3B | -15.2% | 18.2% | 0.9% | 0.7% |
| Utilities | 4 | $7.9B | 30.0% | -1.8% | 11.4% |
10.3% |
The limitation of segmenting the results into multiple sectors are that small sample sizes introduce large variability in the observed values, and apparent results may be due to data-mining effects rather than underlying causal factors.
It is for this reason that the STI and LTI figures are not in the above table, the sample sizes and variations in incentive levels mean that the results may not be indicative.
Methodology
The population of ASX300 listed companies was taken as of the September 2017 S&P ASX300 index rebalancing. Remuneration figures for the executives corresponding to these companies were subsequently obtained from GuerdonData®, a database of remuneration information sourced from the statutory disclosures present in company annual reports.
Companies with financial years ending in December were removed from the sample, since these companies had not disclosed their 2017 remuneration at the time of the analysis. Similarly, companies that listed on the ASX during 2016 or 2017 were removed, since they have no remuneration disclosures available prior to their listing. Companies which lacked statutory disclosures for other reasons were also removed.
Since our analysis spans two sets of reporting periods, it was required that the executives in question held their position for this entire two-year timeframe. Executives which either changed position or served a part-year term were excluded from the analysis.
Following this sample reduction, 173 MDs and CEOs remained in the analysis. Where there was no MD or CEO, the Executive Chairman was analysed.
The sample reduction is a source of bias in the study. Taking the constituent index at the most recent reporting period (Sep 2017) has the effect of excluding companies which have previously fallen out from the index, and replacing them with recent additions. This may cause a positive bias if there is either a correlation between share price performance and remuneration, or market capitalisation and remuneration, since the sample reduction selects for increased share prices and market capitalisations.
1-year total shareholder return (1-year TSR) was elected for benchmarking remuneration against company performance. 1-year total shareholder return figures for the ASX300 listed companies were sourced from Bloomberg. This information was obtained current to the dates of 19th September 2017 (i.e. immediately following the S&P index rebalancing) and 19th September 2016 (i.e. one year prior).
The following abbreviations are used in this document:
- TFR: Total fixed remuneration including cash salary, fringe benefits and superannuation.
- STI: Short term incentives, which is pay contingent on performance measured within a 12-month period.
- LTI: Long term incentives, which is pay contingent on performance over a period greater than 12 months (typically 3 or more years).
- TR: Total remuneration, which is the sum of the above.
For the purposes of this report we have removed negative accounting values of remuneration from the analysis, while positive accounting values are taken as stated. Negative accounting values of short term and long term incentives may arise upon revaluation of the fair value of previously allocated incentives.
Where the STI or LTI was zero in the 2015-2016 period, the percentage change was omitted due to arithmetic error.
© Guerdon Associates 2026 Back to all articles


