
 Subscribe to newsletter

The relationship between executive pay voting and company performance
12/02/2018


It has been assumed that shareholder approval of remuneration reports is related to shareholder returns. While prima facie there may be a case for this argument, unfortunately, no-one has bothered to prove that a relationship exists between shareholder returns and remuneration report votes. At least, until now.
In this article, we test whether there is a relationship between remuneration report voting and total shareholder return for companies listed in the ASX 300.
Analysis
Guerdon Associates correlated total shareholder returns over the year prior to AGM date, Total Assets, and Return on Equity (ROE) in the financial year against proportion of votes against remuneration report.
The table at the end of this article reports estimates and their respective standard error, t-statistic and p-value using the model described in the appendix for coefficients of TSR, Total Assets and ROE.
A higher total shareholder return from one year to the AGM date is significantly and negatively related to votes against the remuneration report. That is, the higher the TSR of a company, the lower the probability of an adverse vote.
The associated p-value of the coefficient of total shareholder return is 0.004. In other words, there is a 99.6% chance of being correct if we conclude that shareholder returns have a negative relationship on votes against remuneration reports (for the glass half empty folks, that is 0.4% chance of being incorrect). Statistically this is a probability of error with which we are pretty comfortable.
TSR is forward looking. It is a measure of the changes in future financial value expected by shareholders. It can be anomalous that a shareholder vote on a report of past remuneration is influenced by expectations of what the company can do for its owners in the future. We note that forward looking TSR is a major input into at least one proxy adviser’s consideration of whether to support a remuneration report. But then, as some issuers believe, when has fairness, logic, and rationality been a driver of remuneration report voting?
So we also tested remuneration voting looking back on financial performance. That is, a measure that should reflect the performance on which remuneration could logically be based. For this we used Return on Equity (ROE).
We found that it is not just TSR that is correlated to pay voting. ROE is also significantly and negatively related to votes against the remuneration report. This implies companies with lower ROE have higher proportion of votes against the remuneration report.
On balance, there appears to be a more weight on “what have you done for me lately” TSR versus “you were good to me once” ROE. We illustrate this a bit further on.
Some would say that larger companies have a harder time of it. Well, we had a look at this too. It is not true. There is not a relationship between remuneration report voting and total assets.
As results indicate a significant negative relationship between total shareholder return and votes against the remuneration report, it is interesting to analyse where this relationship is most prominent.
We sorted the companies into 10 scaled groups based on total shareholder return where group 1 contains companies with the lowest total shareholder returns and group 10 contains companies with the highest total shareholder returns.
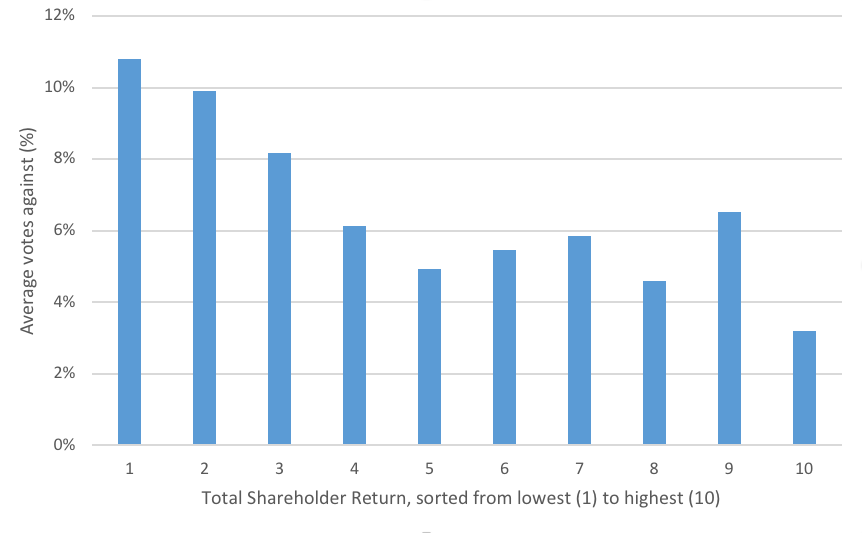
Figure 1: Total Shareholder Return Groups & Votes Against Remuneration Report
Figure 1 shows the relationship between TSR and average votes against remuneration reports are most prominent across groups 1 to 5. Companies in group 6 to 9 are generally flat with a noticeable dip in group 10. This indicates shareholders that have experienced bigger losses are more likely to care, and vote against remuneration report; there is no distinctive voting pattern for shareholders that have experienced average TSRs in the sample. Companies that have performed extremely well (decile 10) in relation to shareholder return have the least votes against remuneration reports, as expected.
As Return on Equity is a significant determinant of average votes against remuneration reports, we present figure 2, where companies are sorted based on return on equity, and allocated into 10 groups. Group 1 contains companies with the lowest ROE and group 10 contains companies with the highest ROE.
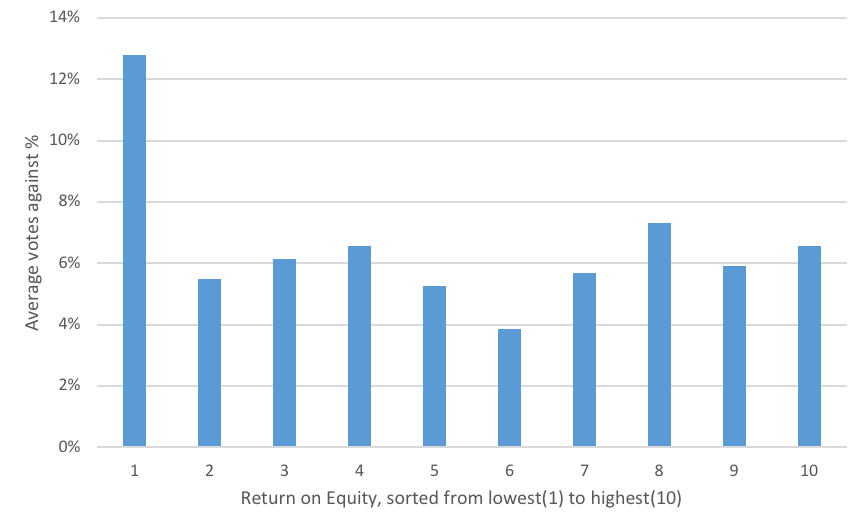
Figure 2: ROE, Grouped & Votes Against Remuneration Report
Interestingly, average votes against remuneration reports are generally stable across groups 2 to 10. Only group 1 is substantially different; as expected, group 1 with the lowest ROE has the highest proportion of votes against remuneration reports.
Importantly, this shows that the significance of ROE in the regression is most likely driven by group 1, the worst performers. Hence, the ROE effect on pay votes is not pervasive across the sample, and we conclude that Total Shareholder Return is the dominant explanatory variable. That is, shareholders vote against last year’s pay based on what they expect performance is going to be in future. Go figure.
The above may have vindicated long-held suspicions held by remuneration committee chairmen and members, but the following graph will provide some pause.
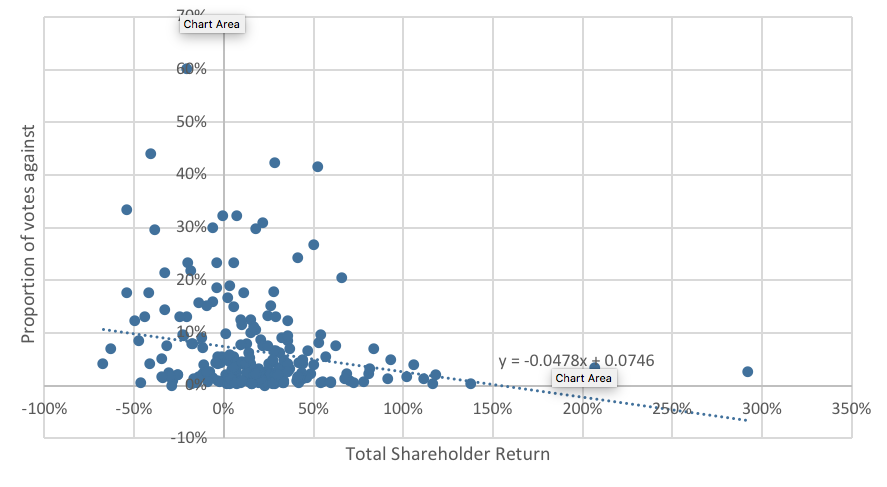
Figure 3: Total Shareholder Return & Votes Against Remuneration Report (%)
Though the trend line in Figure 3 confirms a negative relationship, the data is cluttered with no distinct pattern. So, just in case you think you can be a bit cocky because results are good, the variation in remuneration report votes that can be explained by combining all these variables together is just 5.5%. That is, 94.5% of the variability in remuneration report voting is due to factors other than performance.
The relationship between ROE and the voting results is similar.
(For those of us who can remember back to 1st year statistics, the statistical results are summarised in Table 1).
Table 1 – Regression Coefficients
| Estimate | Standard Error | t-statistic | p-value | |
| Intercept | 0.080 | 0.007 | 11.29 | 0.001 |
| TSR | -0.043 | 0.015 | -2.92 | 0.004 |
| Assets | -0.001 | 0.001 | -0.415 | 0.679 |
| ROE | -0.001 | 0.001 | -2.30 | 0.022 |
| Adjusted R2 | 5.5% | |||
| N | 225 |
We note that the adjusted R-squared value of the regression model in Table 1 is only 5.5%. In other words, the variables in the regression can only explain a small fraction of voting outcomes on remuneration reports.
Conclusion
If shareholders experience very poor returns they are more likely vote against the remuneration report. Size of companies, proxied by assets, are not a significant determinant on votes against remuneration reports. Return on Equity is a significant determinant, but Figure 2 shows that the majority of the effect is observed in lowest ROE decile. It is the shareholders experience, rather than financial metrics such as profitability, which drives the voting outcome.
It could be implied from this conclusion that shareholder votes on the remuneration report may have little to do with how well the remuneration package fits with companies’ goals and objectives.
Yet as discussed, the adjusted R2 of the regression is very low, at 5.5%. This means that while TSR is an important explanatory variable, there may also be other significant external variables that contribute to the determination of votes on remuneration reports, missing from the regression.
And, given that most of the press they get is bad, we can say that it is a good thing there are remuneration consultants who can figure out what these missing ingredients are.
Appendix A: Methodology
To analyse the effect of Total Shareholder Return (TSR) on pay voting outcome, we considered companies in the S&P/ASX300. Voting outcomes were sourced from Bloomberg and relevant disclosures. We only examined companies that held annual general meetings to vote for the adoption of remuneration reports in 2017, which reduced total observations to 225.
We calculated the percentage of votes against the remuneration report, and TSR over a one-year period prior to the Annual General Meeting date for each company before running the following regression:
Votes_Againsti = α + Β1*TSRi + Β2*Assetsi + Β3*ROEi + εi i = 1,…, N
where Votes_Againsti and TSR were the percentage of votes against the remuneration report and one-year total shareholder return up to the AGM date, Assetsi was Total Assets and ROEi was Return on Equity of the ith company respectively, and N = 225 observations.
For robustness, we also tested the relationship using a logit model, where the dependent variable takes a value of 1(0) if votes against the remuneration report is equal to or above (below) 10%. The results are significant and consistent with our original findings. In addition, we replaced ROE with Return on Assets for profitability and obtained similar results.
© Guerdon Associates 2026
 Back to all articles


