
 Subscribe to newsletter

Executive pay is not distributed equally
07/11/2022


As “right wing” (aka conservative) parties move to attract the disenfranchised and lower income cohorts with more market intervention and handouts, and “left wing” (aka progressive) parties move to attract the educated and higher income cohorts with middle class welfare, some may consider the world going topsy turvy.
Heaven forbid if executive pay is to show signs of socialist tendencies evident elsewhere. As we do most years, we venture to run the ruler over executive pay to find out.
Our research considers the pay relativity of ASX 300 executive KMPs relative to their CEO. This repeats the internal relativity pay analysis of April 2021 (see HERE).
Pay relativity is calculated as the ratio of remuneration between each executive KMP and the company’s CEO. The chart below displays the median pay relativity across the ASX 300 for entire executive KMP team, as well as for the first, second and third highest paid incumbent in each company.
Figure 1: Median direct report remuneration relative to CEO
The median total remuneration of the highest paid direct report is 48% of the CEO’s pay. The median total remuneration of the second and third highest direct reports are 42% and 39%, respectively, of the CEO’s pay.
The conclusion is the same as Guerdon Associates’ 2021 internal relativity pay analysis – there is no ‘fairness’ bias among executive KMP pay. That is, pay is not distributed evenly across the executive KMP team. More valued talent still requires better compensation to attract and retain.
Additionally, we analysed the pay relativity between the highest paid and the second highest paid direct report, and between the second and third highest. The figure below illustrates our findings.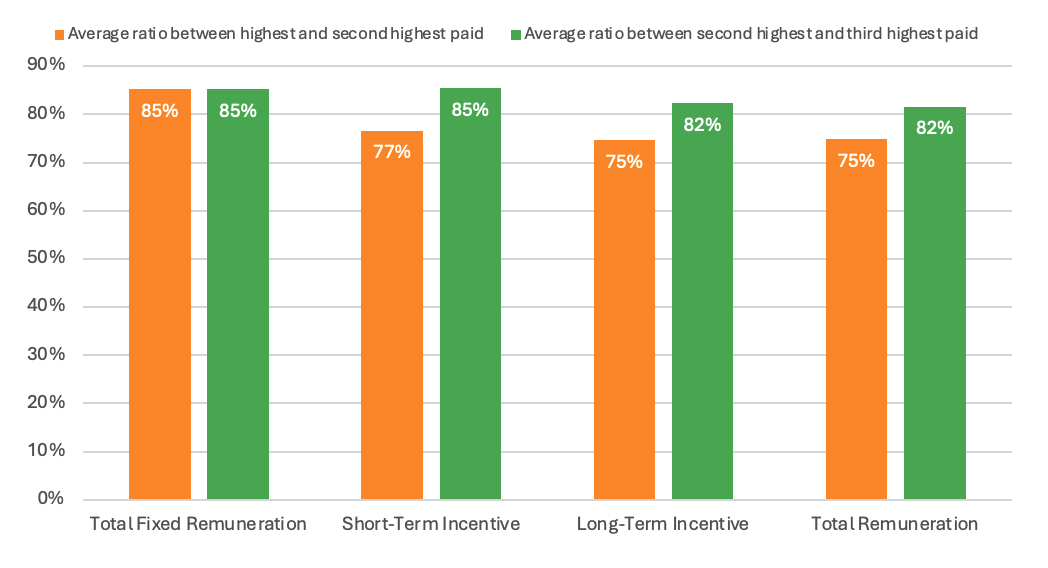
Figure 2: Average executive KMP pay relativity, excluding CEO
We compared the results of this analysis with that of the previous research to discern any significant changes. The figure below reflects the change in pay relativity since our analysis in April 2021, calculated as the difference between current median pay relativity and median pay relativity from our previous research.
The magnitude of median relativity change for total remuneration is minor (less than 5%).
Figure 3: Change in median pay relativity since April 2021
In conclusion, we can say that pay is differentiated between executive positions, suggesting market factors remain at work.
Statutory remuneration data used in this analysis was sourced from GuerdonData®. Only data for incumbents with at least 3 years tenure at the end of the financial year were utilised. Doing so allows for a robust look at pay trends across the companies. This sample accounts for 159 companies with the remuneration for the CEOs and direct reports disclosed. Companies with financial year end June 2022 were included where available.
© Guerdon Associates 2026 Back to all articles


