
 Subscribe to newsletter

09/03/2018


Over the years, we have observed that boards with a significant proportion of women members demonstrate more constructive and open debates of issues, with more equal and balanced participation of board and committee members. Based on our observations (albeit, biased to larger companies), we would expect these boards to perform well in comparison to their peers.
Back in 2014, Credit Suisse released a research report that received a lot of attention (see HERE). Its conclusion? That boards with women on them perform better (measured by ROE, price to book value and payout ratio). Credit Suisse released a report in 2016 confirming the results of the 2014 study (See HERE).
Yet other studies have encountered different results. A summary of peer reviewed academic research conducted over recent years concluded that any relationship between board gender diversity either does not exist or is only very weakly positive. (See HERE.)
Most studies are international and if they use Australian data, only do so in a limited context. Yet Australia has a relatively high number of women on boards relative to other countries (see HERE), although there are concerns it is plateauing.
We decided to investigate the question ourselves in the Australian market, examining the relation between gender diversity of ASX 300 listed company boards of directors and risk-adjusted shareholder returns.
Risk-adjusted metrics take into account how risky an investment is when evaluating the return. In our mind, such metrics are they only valid way to compare performance on an “apples to apples” basis (see HERE).
We tested the hypothesis that the average daily risk-adjusted return during 2017 for boards with at least 30% women was significantly different to that of boards with less than 30% women. Our analysis found no evidence that the risk-adjusted returns were significantly different.
Although this may not be the answer that advocates for women on boards may want to see, in some ways it makes perfect sense. That is, gender makes no statistically significant difference to performance.
Nevertheless, to avoid the rocks about to be thrown in our general direction, let us be the first to identify possible methodological flaws that advocates will no doubt find.
Since our statistical analysis relied on looking at the variance of the means between the two groups, there could potentially be outliers with particularly high returns that are skewing the result.
Our study considered single year excess returns and performance. One key issue with our study is that the effect of board gender diversity may manifest itself in long-term, rather than short term business decisions. In this case, the effect will only be relevant where the board held a large proportion of women in prior years. Consequently, a longitudinal study tracing the long-term performance of companies with high-proportions of female representation on the board may be more appropriate than examining a single year of results.
In addition, the results depend heavily on the assumptions or methodology chosen to calculate alpha (the risk adjusted return measure we chose). It considered alpha on a daily basis, delivering a different result to if we had considered alpha on a monthly basis.
Lastly, and most importantly, we note that correlation does not imply causation. There are likely to be multiple confounding factors that could explain any observed difference in returns and performance.
Methodologically, these are the biggies, we think.
In any case, what follows are the details. We are sure that some of you will find more aspects to consider for next time. Let us know, preferably not wrapped around a rock.
The details and results
Jensen’s alpha provides a measure of risk-adjusted returns, where the returns are measured against those of a benchmark adjusted for the company’s riskiness in comparison to that index. In our case the benchmark is the ASX300 Index return.
Our hypothesis looked at whether the average daily risk-adjusted return during 2017 for boards with at least 30% women was significantly higher or lower than that of boards with less than 30% women.
To test this hypothesis , we compare performance for two groups (>=30%+ women on the board, <30% women on the board) and used statistical tests to determine whether any difference in average risk-adjusted return is statistically significant (is likely to be purely chance or a true correlation). The result was not significant at the 5% level. When we looked at two groups of >40% women and <40% women on the board, the result was also not significant. The sample size of boards with >=40% women was small at only 17 companies, and hence the test requires a large difference in average returns in order to say that any difference is not purely due to chance.
Conclusion
We found no significant correlation between boards with greater or less than 30% women and the daily risk return for 2017. Absence of any statistically significant difference is consistent with overseas studies.
Methodology
The list of ASX 300 constituent companies was generated current to the date 1st Jan 2017. This was intended to remove the selection bias of recent additions and removals from the index. Percentage of women on the board of directors was obtained for the last reported date in 2017. Where Bloomberg lacked information on the composition of the board, these companies were excluded from the analysis.
Total shareholder return from the period of 1st Jan 2017 to all trading days of the Australian Securities Exchange during the 2017 calendar year. All subsequent financial metrics were calculated from the total shareholder return data. Where gaps in trading for particular securities occurred on trading days for the overall market, the one-day total shareholder return was equated to zero.
Explicitly, Jensen’s alpha is the difference between the realised return of an individual investment and the expected rate of return determined by the Capital Asset Pricing Model (CAPM). Mathematically, this is expressed as:
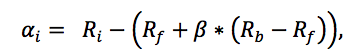
where Ri is the return of the individual asset, Rb is the benchmark return (taken for our purposes to be the total shareholder return of the S&P ASX 300), Rf is the risk-free rate (taken to be the average yield on 10-year Australian Government Bonds during the relevant performance period (2.65% for 2017)).
To calculate β, daily changes in the total shareholder return of the individual stock were regressed against daily changes in the total shareholder return of the ASX 300 index. The coefficient of the regression is an estimate of β.
© Guerdon Associates 2025 Back to all articles


