
 Subscribe to newsletter

A review of the 2021 board director fee pay increases
04/02/2022


As we enter a new year, it is time to review remuneration changes for ASX300 board chairmen and other non-executive directors (NEDs).
Overall
A total of 933 same incumbent full year chairmen and other NEDs across 215 companies were used for the sample, taken from companies listed in the ASX300 between FY 2020 and FY 2021.
The median increase in remuneration was 0% for chairmen and 0.04% for other NEDs.
Given COVID-19 uncertainty during this period, the low increase in remuneration is to be expected. This follows on from FY 2019 to FY 2020 when the median increase was at 0.43% for chairmen and 1.65% for other NEDs (see HERE).
Table 1 presents the change in fees, broken down into chairmen and other NEDs.
Table 1: Chairmen and other NED remuneration adjustments by position
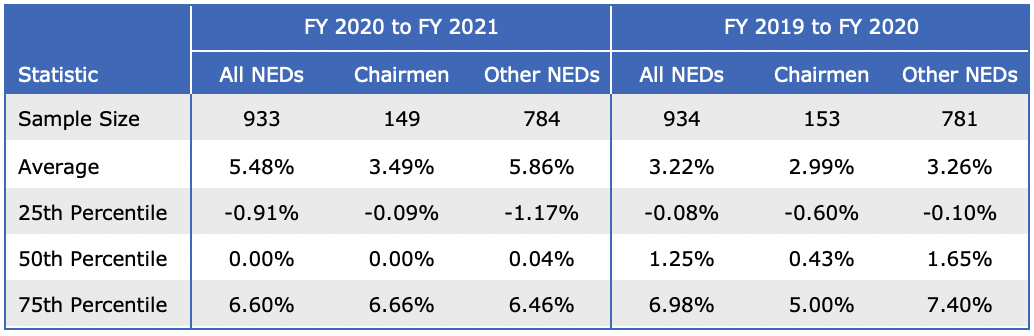
Table 2 shows the breakdown of changes in NED total remuneration.
Table 2: Percentage of NEDs by change in remuneration
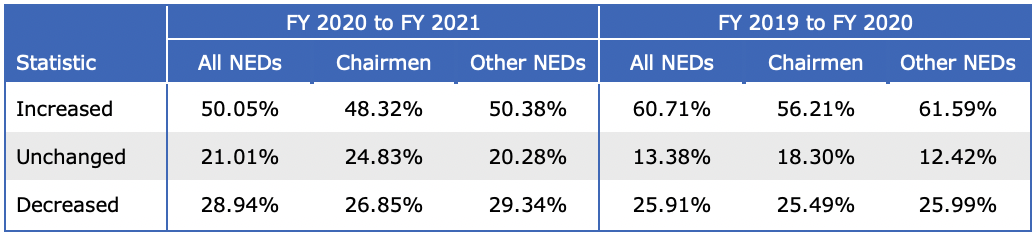
The percentage change of all NEDs who experienced an increase in remuneration, had been reduced to 50.05% in FY 2020 to FY 2021 from 60.71% in FY 2019 to FY 2020. In FY 2020 to FY 2021, 48.32% of chairmen experienced an increase in remuneration, which is a decrease from 56.21% in FY 2019 to FY 2020. The percentage of other NEDs whose remuneration increased had also declined from 61.59% to 50.38% in FY 2020 to FY 2021.
Table 2 shows:
- An increase in the number of unchanged chairmen remuneration of 24.83% in FY 2020 to FY 2021, which increased from 18.3% in FY 2019 to FY 2020.
- In FY 2020 to FY 2021, 20.28% of other NEDs experienced no change in remuneration which is an increase from 12.42% in FY 2019 to FY 2020.
- A total of 26.85% of chairmen and 29.34% of other NEDs experienced a decrease in remuneration for FY 2020 to FY 2021. This is a higher percentage of NEDs experiencing a decrease in remuneration than in FY 2019 to FY 2020 which was 25.49% for chairmen and 25.99% for other NEDs.
Given that most boards only amend fee levels every 2 or 3 years, rather than annually, we looked at the extent of increase only for those boards making an adjustment.
Table 3 shows the summary statistics for the 50.05% of boards that increased their fees during FY 2020 to FY 2021, compared to FY 2019 to FY 2020.
Table 3: Chairmen and other NED remuneration increases by board role
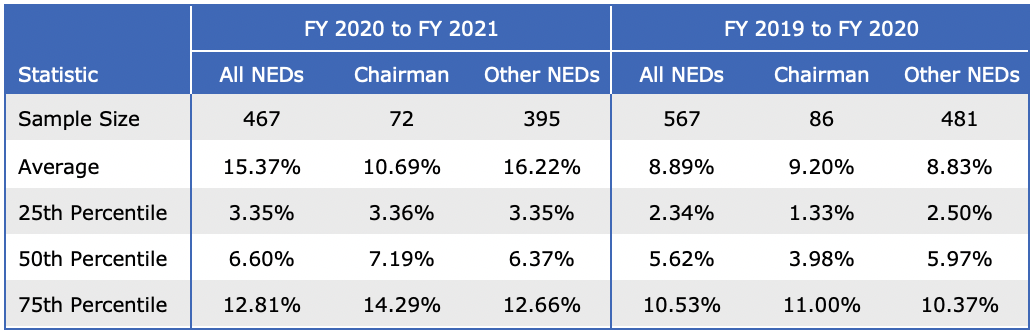
Table 3 reiterates the observations in Table 2, as there is a reduction in the number of NEDs receiving increases in remuneration. Of the chairmen that received an increase in remuneration, 7.19% was the median increase in their fees in FY 2020 to FY 2021 compared to 3.98% in FY 2019 to FY 2020. In FY 2020 to FY 2021, the other NEDs had a 6.37% median increase in fees in comparison to 5.97% in FY 2020 to FY 2021.
Figure 1 and Figure 2 displays the distribution of total remuneration in FY 2020 and FY 2021 for chairmen and other NEDs respectively.
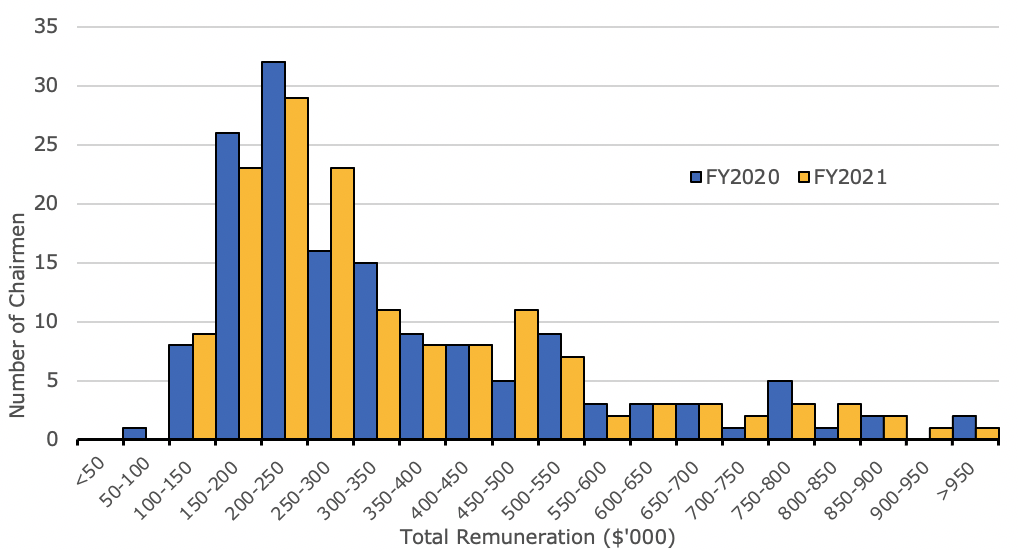
Figure 1: Comparison of yearly distribution of chairmen fees
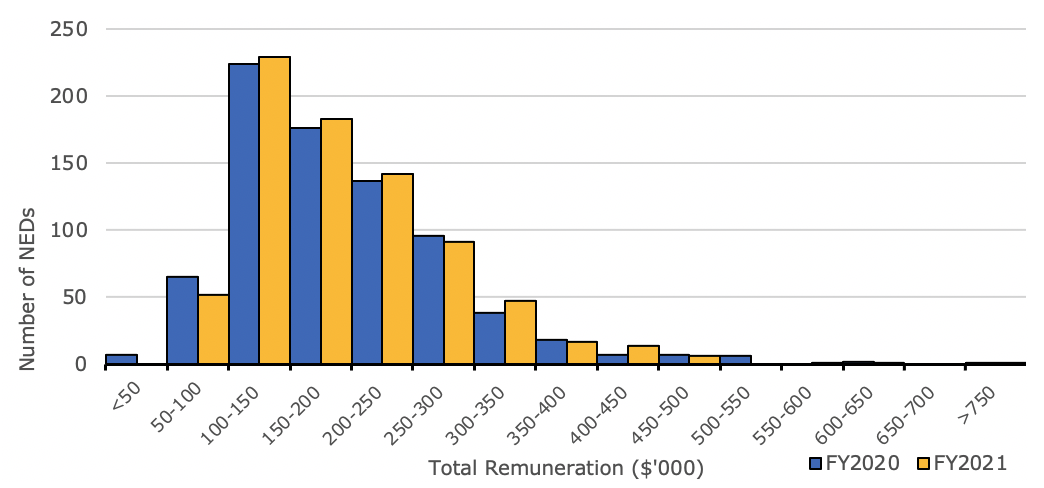
Figure 2: Comparison of yearly distribution of other NED fees
The majority of chairmen in FY 2021 were paid between $150,000 and $300,000 with the largest group being paid between $200,000 to $250,000. The $200,000 to $250,000 grouping of chairmen was also the largest group in FY 2020.
In Figure 2, a similar distribution for NEDs is observed between FY 2020 and FY 2021.
By Company Size
Chairmen and other NEDs’ total remuneration were divided into 4 groups based on the quartiles of companies’ 30-day market capitalisation up to 30 June 2021. The first, second and third quartiles were $1,142m, $2,884m and $7,670m.
Table 4 shows the change in remuneration based on these quartiles for chairmen
Table 4: Chairmen median and average change in remuneration by company size
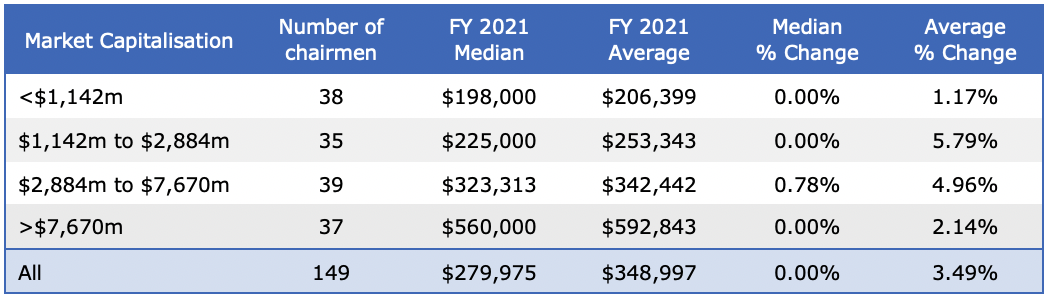
The second largest size group based on market capitalisation, between $2,884m to $7,670m, had the largest change in median pay for chairmen in FY 2020 to FY 2021. This group had a median increase of 0.78%.
The other quartiles of market capitalisation recorded no median change in chairmen pay for FY 2020 to FY 2021.
Table 5 shows the change in remuneration based on the quartiles for the other NEDs
Table 5: Other NEDs’ median and average change in remuneration by company size

For the other NEDs, the second largest group based on market capitalisation is also observed to have a median change in FY 2020 to FY 2021. This group observing a median percentage change of 0.04%.
The other quartiles of market capitalisation were observed to have no median change in NED remuneration for FY 2020 to FY 2021.
By Company Sector
Chairmen and other NEDs were divided into 11 groups based on the company GICS sector classification.
Table 6 shows the chairmen change in remuneration based on these GICS sectors.
Table 6: Chairmen median and average change in remuneration by GICS sector

The median chairman fees in Communication Services, Energy, Financials and Materials sectors had no change. The median chairman fees in the Consumer Discretionary sector saw the largest percentage increase of 6%. This is followed by the Utilities sector at 4.80%, which also had the highest median chairman fee.
Information Technology with the lowest median FY 2021 fee for chairmen saw a median increase of 0.08%.
Table 7 shows other NED remuneration changes based on GICS sectors.
Table 7: Other NEDs median and average change in remuneration by GICS sector
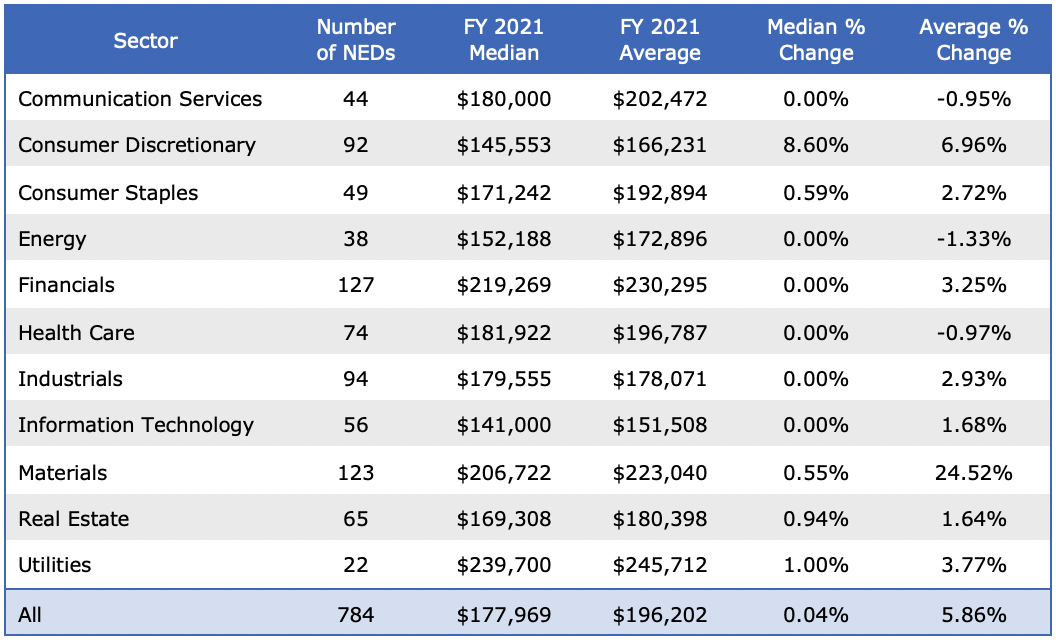
Communication Services, Energy, Financial, Health Care, Industrials and Information Technology sector saw a 0% median change in other NED remuneration.
NEDs in Consumer Discretionary saw the largest increase in the median NED fees with a median percentage change of 8.60%. This compares to the decrease of 4.13% in the prior year. Earlier research on ASX 200 COVID-19 remuneration adjustments (see HERE) revealed Consumer Discretionary companies made up the highest proportion of temporary COVID-19 negative remuneration adjustments. These COVID-19 adjustments were typically a 20% reduction in board fees for 3 months with most reductions ending at the conclusion of FY2020. The return to normal fees for FY2021 helps explain the large increase in Consumer Discretionary NED fees.
Utilities had the highest median NED fees in FY 2021. This sector saw a median fee increase of 1%. The Real Estate, Consumer Staples and Materials sectors saw median increases in NED fees of less than 1% at 0.94%, 0.59% and 0.55% respectively.
Methodology
The data was derived from GuerdonData®, which is the proprietary database by Guerdon Associates for executive and director pay for all companies in the ASX300. (Available for client subscription, to try our demo product, click HERE). For enquiries regarding a subscription, please contact us on info@guerdonassociates.com.
Companies with financial years ending in December or that are yet to disclose their 2020 annual reports at the time of analysis were not considered in the study. Similarly, NEDs that changed position during the time of study were excluded from the sample, as well as those who were not in their position for the full 2 years. Companies that were only added or removed from the ASX300 during the duration of the sample time period have also been excluded from the study.
The market capitalisation of companies was taken on a 30-day average up to the 30 June 2021. Therefore, for companies that were delisted between the end of 2020 and this time period, we were able to take their market capitalisation from that time period.
Exchange rates for directors paid in a foreign currency were taken as the daily average for the respective exchange rate during the relevant financial year.
Calculations and percentages were made on each NED’s change in remuneration.
© Guerdon Associates 2026 Back to all articles


