
 Subscribe to newsletter

Which NEDs did COVID hit the hardest? 2020 NED fee adjustments
08/02/2021


As we enter a new year, it is again time to review pay for chairmen and other non-executive directors (NEDs) in the ASX300 in between 2019 and 2020. Given the effect of COVID-19 in the past year, any changes in the NED fees will be recorded in the 2020 data. See HERE for our list of companies within the ASX200 that have made changes to their remuneration during the year.
Overall
A total of 934 “same incumbent” full year chairmen and other NEDs across 209 companies were used for the sample, taken from the statutory disclosures of companies in the ASX 300 between FY2019 and FY2020.
The median increase in remuneration was 0.43% for chairmen and 1.63% for other NEDs.
Given current global circumstances, the low increase in remuneration is to be expected. This is much lower than the increase between FY2018 and FY2019 which was 1.85% for chairmen and 2.50% for other NEDs (see HERE).
Table 1 presents the change in fees, broken down into chairmen and other NEDs.
Table 1: Chairmen and other NED remuneration adjustments by position
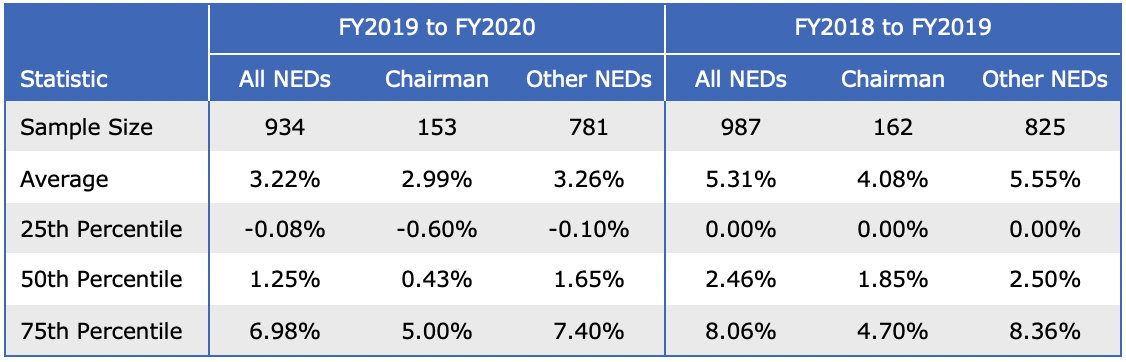
The median percentage change in remuneration received by chairmen of 0.43% in FY2019 to FY2020 was lower than the change of 1.85% in FY2018 to FY2019. NEDs also saw a shift in the increase in remuneration with the median percentage change in FY2019 to FY2020 being 1.65%, lower than the percentage change in FY2018 to FY2019 of 2.5%.
Table 2 shows a breakdown of the changes in NED total remuneration.
Table 2: Percentage of NEDs by change in remuneration
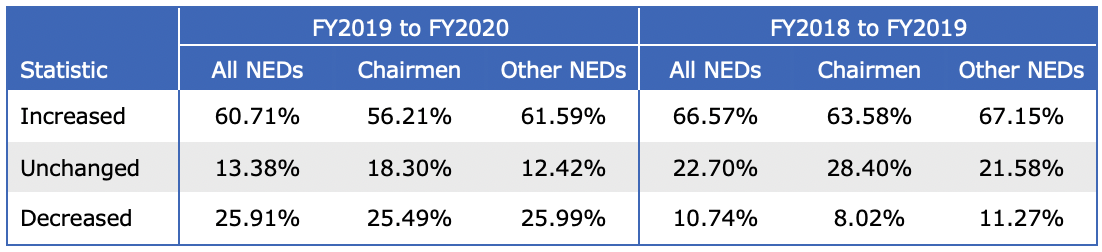
The percentage of chairmen who experienced an increase in remuneration decreased from 63.58% in FY2018 to FY2019 to 56.21% in FY2019-2020. In FY2018 to FY2019, only 8.02% of chairmen experienced a decrease in remuneration. This has increased to 25.49% in FY2019 to FY2020. Remuneration remained unchanged for 18.30% of chairmen in FY2019 to FY2020, down from 28.40% in FY2018 to FY2019 .
Table 2 also displays 61.59% of NEDs other than the chairman experienced an increase in FY2019-2020, down from 67.15% in FY2018 to FY2019 . A total of 12.42% of other NEDs experienced no change in remuneration in FY2019 to FY2020 compared to 21.58% in FY2018 to FY2019 . The remaining 25.99% of the NEDs in FY2019 to FY2020 experienced a fee decrease, much higher compared to FY2018 to FY2019 of 11.27%.
The larger percentage of NEDs that experienced a decrease in remuneration over the FY2019 to FY2020 compared to the FY2018 to FY2019 is probably due to the pandemic. This was also reflected in the study for CEO remuneration changes (see HERE).
Table 3 shows the summary statistics for the 60.71% of boards that increased their fees during FY2019 to FY2020, compared to the FY2018 to FY2019 summary statistics.
Table 3: Chairmen and other NED remuneration increases by board role
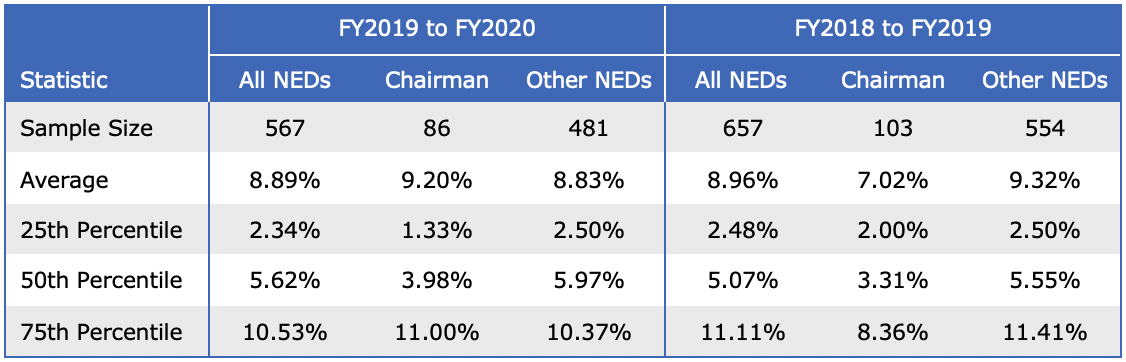
Fewer companies increased NED remuneration in FY2019 to FY2020. The median increase of chairman and NED fees in FY2019 to FY2020 is similar to increases in FY2018 to FY2019.
Figure 1 below presents the distribution of total remuneration for chairmen. It shows that the majority of chairmen tend to be paid between $150,000 to $300,000. A slight increase from FY2019 where it was more concentrated between $100,000 to $300,000.

Figure 1: Comparison of yearly distribution of chairmen total remuneration
In both FY2019 and FY2020, more chairmen were paid above $250,000.
Figure 2 below presents the distribution of total remuneration for other NEDs. It shows that the majority of them tend to be paid between $50,000 to $250,000, as per previous years.
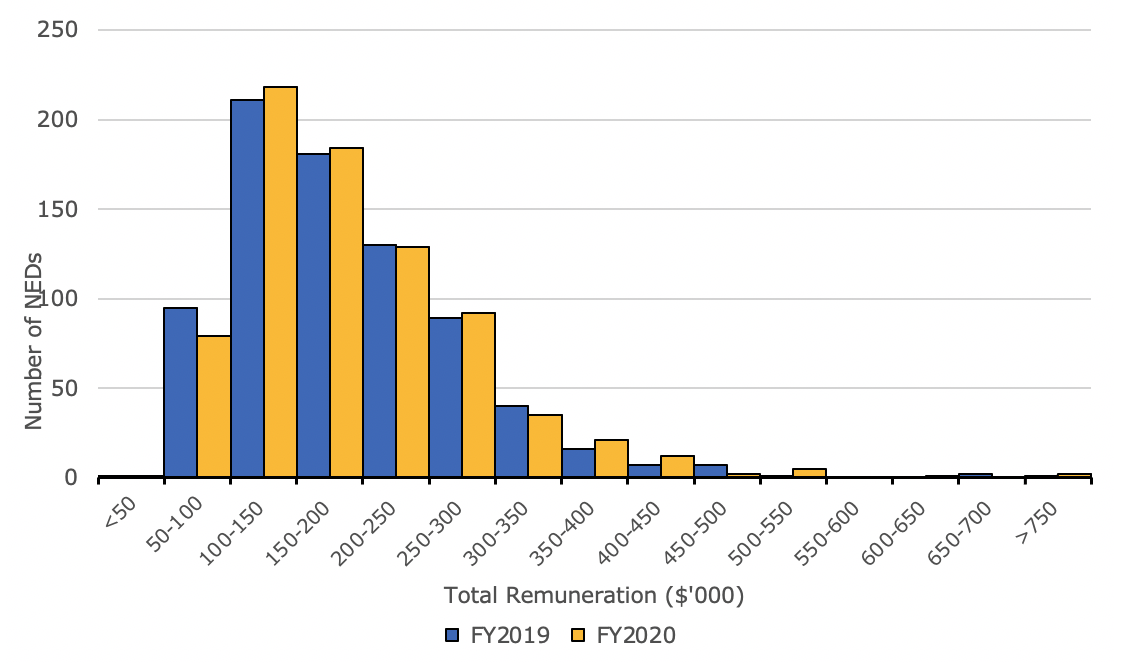
Figure 2: Comparison of yearly distribution of other NEDs total remuneration
For both FY2019 and FY2020, more NEDs were paid above $150,000.
For FY2020 chairmen and other NEDs, 79.53% receive superannuation while 6.65% have share-based payments. As such, there is no need to make contributions to the NED’s superannuation.
By Company Size
Chairmen and other NEDs’ total remuneration were divided into 4 groups based on the quartiles of the companies’ 30-day market capitalisation up to 30 June 2020. The first, second and third quartiles were $799m, $2,034m and $6,423m.
Table 4 shows the change in remuneration based on these quartiles for chairmen.
Table 4: Chairmen median and average change in remuneration by company size
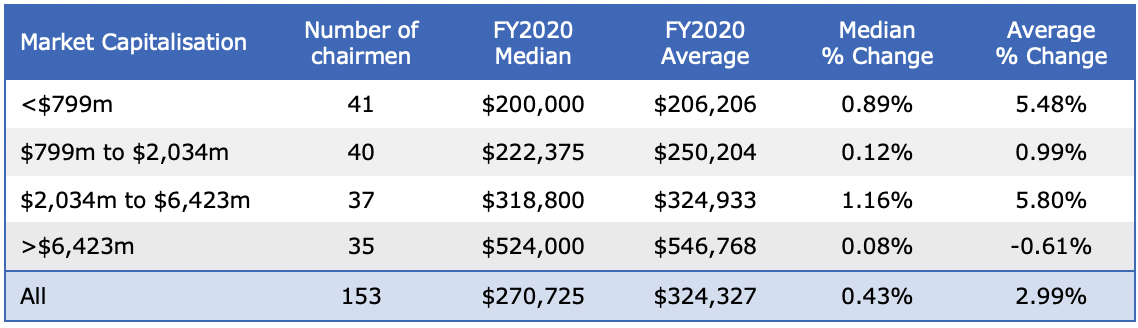
For the second largest size group, between $2,034m and $6,423m market capitalisation, FY2019 to FY2020 chairmen had the largest change in median pay. They had a median increase of 1.16%.
The second largest median increase was in the smallest size group with market capitalisation below $799m, with a median pay increase of 0.89%.
The third largest group (companies between $799m and $2,034m market capitalisation) median chairman experienced the third highest pay increase of 0.12%.
The median chairman of the largest group by company size, companies over $6,423m, fared the worst, with a pay increase of 0.08%.
Table 5 shows the change in remuneration based on the aforementioned quartiles for the other NEDs.
Table 5: Other NEDs’ median and average change in remuneration by company size
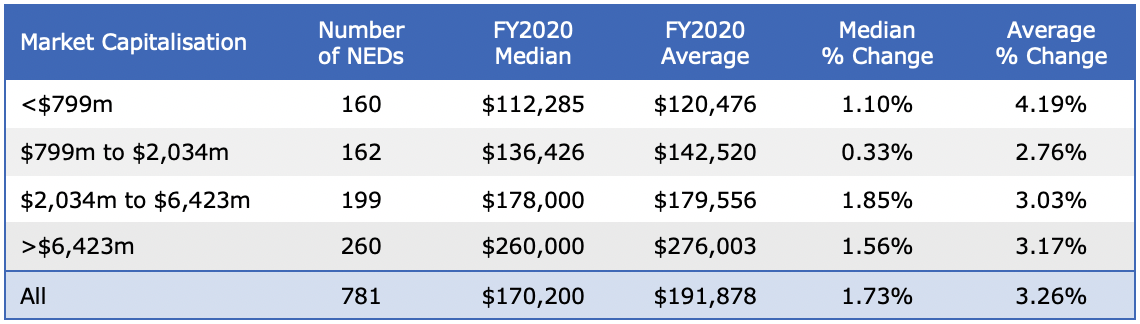
The second largest group by company size experienced the highest increase in median pay for NEDs. These NEDs had a median pay increase of 1.85%.
The largest group by company size experienced the second highest increase in median pay for NEDs. These NEDs had a median pay increase of 1.56%.
The two smallest size groups had median NED pay increases of 0.33% and 1.10%, respectively.
For FY2019-2020, average and median NED remuneration increases were higher than chairmen increases across all size groups.
By Company Sector
Chairmen and other NEDs were divided into 11 groups based on the company GICS sector classification.
Table 6 shows the chairmen change in remuneration based on these GICS sectors.
Table 6: Chairmen median and average change in remuneration by GICS sector
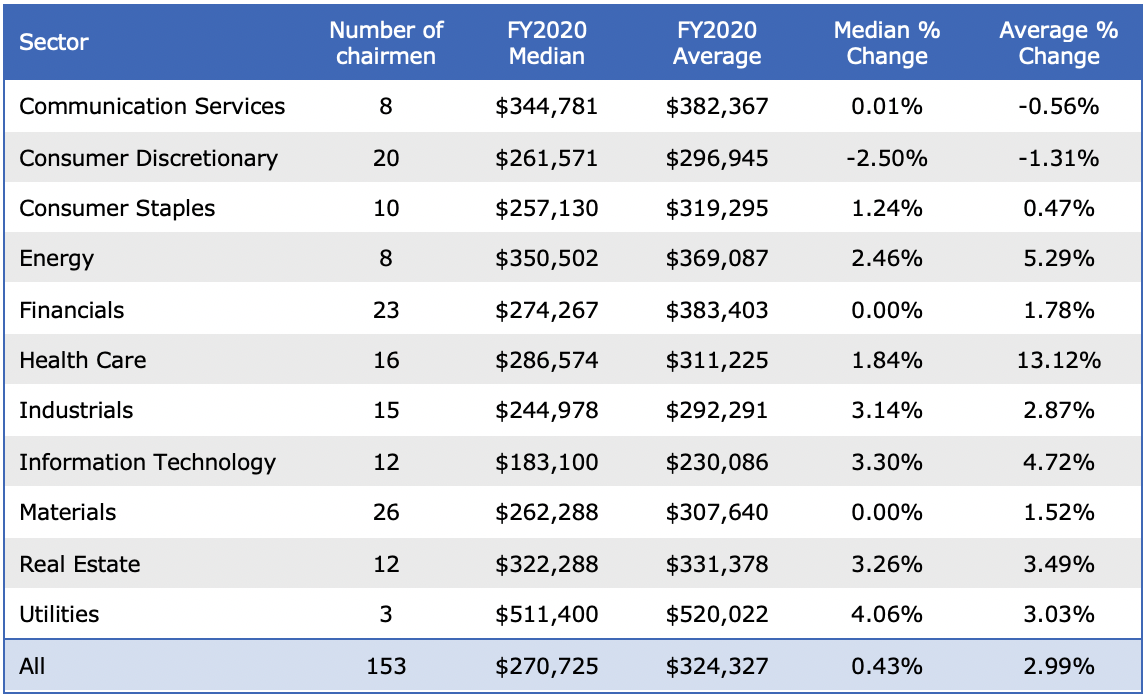
The median chairman in the Financials and Materials sectors had no change in fees. The median chairman in the Communication Services sector saw a slight increase of 0.01% in fees.
Incumbent chairmen from the Utilities sector again received the largest median increase at 4.06%. The median chairman in the Information Technology sector experienced the second highest percentage fee increase of 3.30%.
On the other end of the spectrum, chairmen of companies in the Consumer Discretionary sector saw a negative change in the median of their fees, decreasing by -2.50%.
Table 7 shows the other NEDs change in remuneration based on GICS sectors.
Table 7: Other NEDs median and average change in remuneration by GICS sector

The Financials and Real Estate sector both saw less than 1% increases in the median NED fees.
The Information Technology, Consumer Staples and Health Care sector median NED fees had the highest increase percentage increases of 6.58%, 4.00% and 3.26% respectively.
The Consumer Discretionary sector again saw a decrease in the median NED fee, decreasing by 4.13%. This is reflective of the industry being the hardest hit from the COVID-19 pandemic this past year as NEDs and executives reduced their fees to preserve the company.
Methodology
The data was derived from GuerdonData®, which is the proprietary database by Guerdon Associates for executive and director pay for all companies in the ASX300. (Available for client subscription, to try our demo product, click HERE. For enquiries regarding a subscription, please contact us on info@www.guerdonassociates.com).
Companies with financial years ending in December or that are yet to disclose their 2020 annual reports at the time of analysis were not considered in the study. Similarly, NEDs that changed position during the time of study were removed from the sample, as well as those who were not in their position for the full 2 years. Companies that were only added or removed from the ASX300 during the duration of the sample time period have also been removed from the study.
The market capitalisation of companies was taken on a 30-day average up to the 30 June 2020. Therefore, for companies that were delisted between the end of 2019 and this time period, we were able to take their market capitalisation from that time period.
Exchange rates for directors paid in a foreign currency was taken as the daily average for the respective exchange rate during the relevant financial year.
Calculations and percentages were made on each NED’s change in remuneration.
© Guerdon Associates 2026 Back to all articles


