
 Subscribe to newsletter

ASX 300 CEO median total remuneration declined in 2019
10/02/2020


As we look forward to a new decade, it is time for Guerdon Associates’ annual review of pay increases for incumbent Chief Executive Officers (CEOs) and Managing Directors (MDs) who led ASX 300 companies in the past 2 reporting periods.
Summary
Executive pay increases are less than increases for the general population. Although Australian Bureau of Statistics reporting only extends to March 2019, total earnings growth to then was 2.7%, whereas executive pay average 2019 total earnings growth was 1%.
Almost 39% of CEOs did not receive any increase in fixed pay. About 53% saw a decline in annual incentive. Although half of the sample saw higher LTIs, this was insufficient to stem a decline in median ASX300 CEO total remuneration. Less than half of the CEOs in the sample received an increase in total remuneration of over 1%.
While some CEOs were lucky, and received increases, many were not, which is reflected in the sample data. Overall, fixed pay and total remuneration (TR) median increases were 2.36% and 1% respectively. Short-term incentives (STIs) saw a median decrease of 2.32%. Long-term incentives (LTIs) saw a median increase of 3.19%, respectively.
Consistent with prior periods, pay increases significantly lagged the median Total Shareholder Return (TSR) of 10.06%. That is, shareholders benefitted more than CEOs.
Median total fixed remuneration (TFR) growth is lower as company size increases. Median STI has fallen across all companies regardless of size.
The IT sector continues to see strong increases in all components of pay, possibly reflecting the flood of investment into this sector and IT CEO supply and demand. Communication companies saw the largest fall in TR, as it was the sector with the largest decline in incentive pay.
Overview
One hundred and forty-seven ASX 300 CEOs were in their position for 2 full years. This formed the population on which the analysis was conducted. Remuneration data was sourced from GuerdonData®, and TSR data taken from Bloomberg®.
The median change in total fixed remuneration (TFR) in FY 19 was an increase of 2.36%, roughly the same as the analysis conducted last year (see HERE) . TR increased by 1%, a fall from the 4.9% increase seen last year. This is by far lowest annual increase for some time, as can be seen in Figure 1 below.
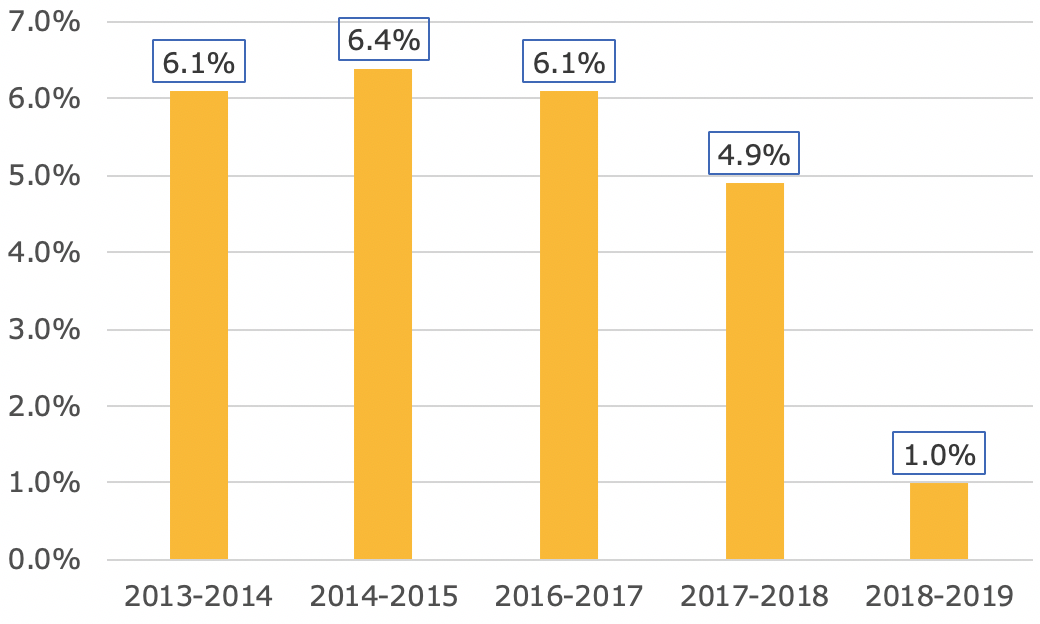
Figure 1: Total remuneration changes over the years
This stark decrease in growth can largely be attributed to the change in STIs paid.
Both STI and LTI reflect statutory disclosures, which include the amortised value of the share-based payments expense when LTIs are delivered as rights, options, SARs, loan shares, cash, or restricted shares. STI is contingent on performance over 12 months, while LTI is contingent on performance for a period greater than 12 months.
The amount of STIs paid last year fell across the ASX 300. Median year-on-year growth in STI decreased from 2.47% to -2.32%. LTIs saw a median increase of 3.19%.
From Figure 2, we see while the interquartile range largely remains the same, there is a decrease in the median for STIs and TR.
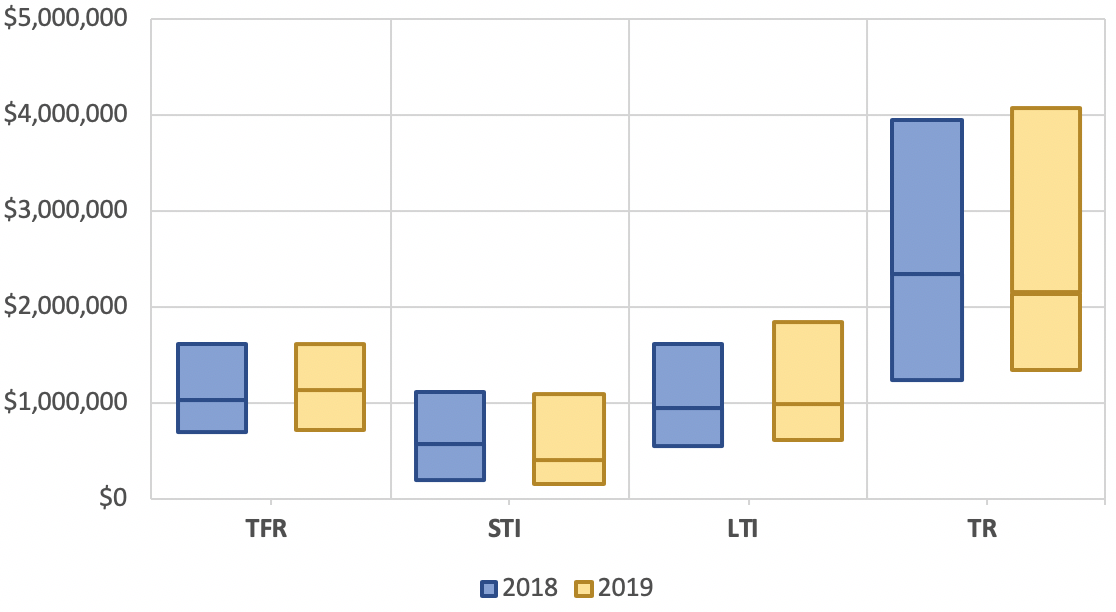
Figure 2: Quartile yearly ASX 300 CEO remuneration by remuneration component
By Company Size
We segmented companies into quartiles based on their 30-day average market capitalisation, as at the 30th September 2019.
Table 1: Median % change in remuneration and TSR by market capitalisation quartiles.
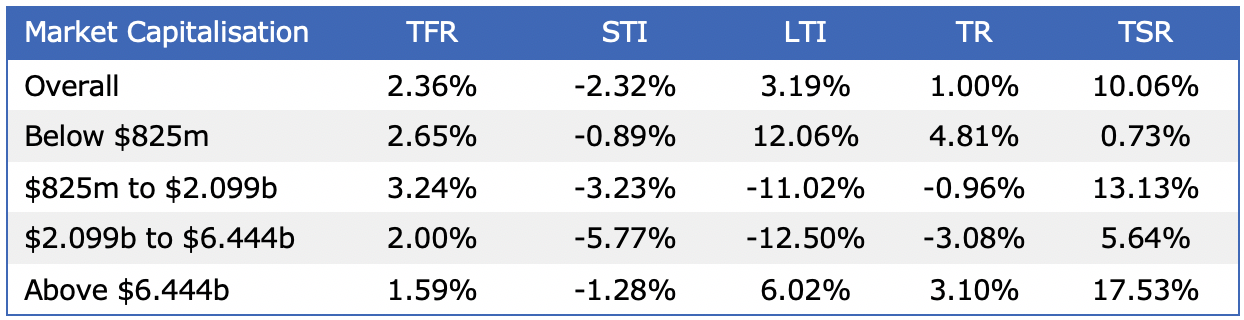
From this analysis, three interesting trends have emerged:
- For companies over $825 million, as market capitalisation increases, the median growth in TFR mainly decreases;
- STI payout across the board has decreased compared to last year; and
- LTI for the year also decreased for the mid-sized companies.
By Sector
We classified each company in our sample according to their (GICS) sector. The table below shows the change in remuneration across the different sectors:
Table 2: ASX 300 GICS sector breakdown of median change in CEO pay
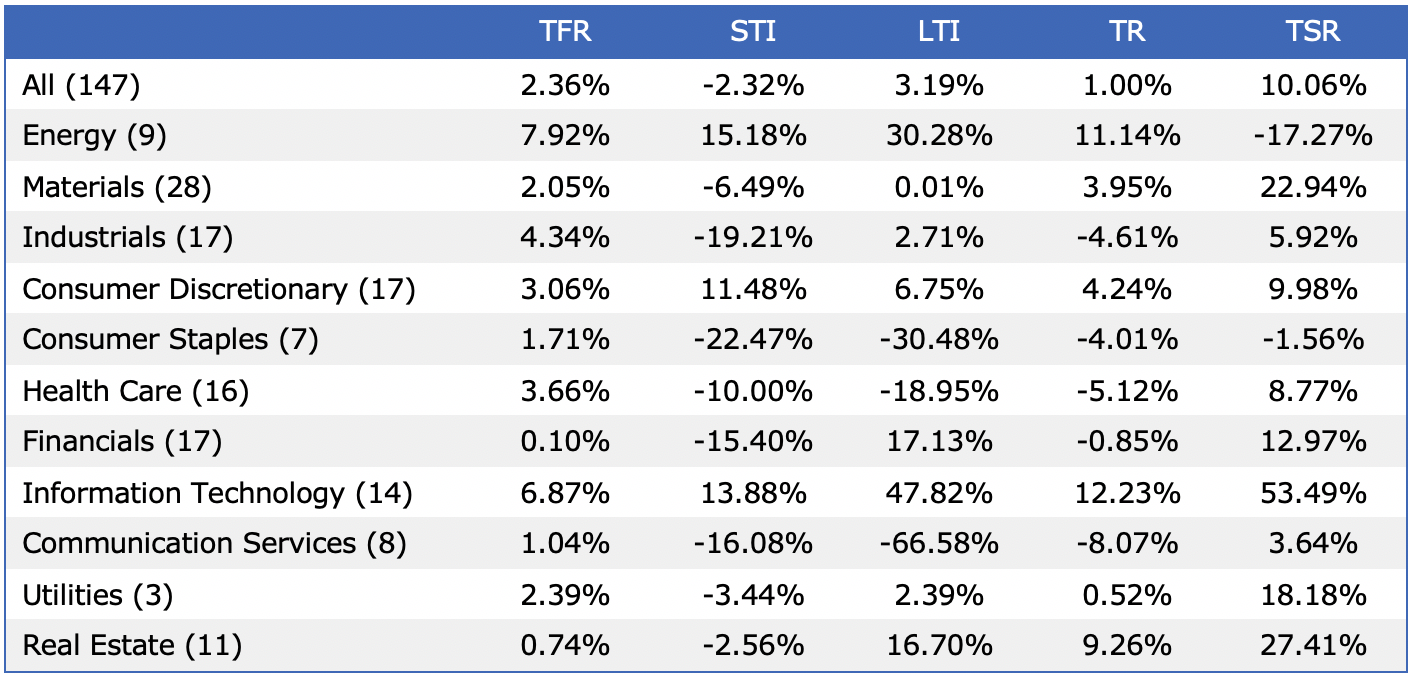
The Information Technology sector received the second highest growth in median TFR with 6.87%. It received the largest sector median total remuneration increase of 12.23%. This was driven by all remuneration components, with TFR, STI and LTI growth all amongst the top 2 sectors.
The Communication Services sector saw the largest fall in TR. This was driven by having the largest declines in LTI, in contrast to last year where it had the largest increase in LTI growth. STI declined by 16.08%.
As the fallout from the Hayne Royal Commission continues, Financial sector CEO STIs saw a decrease of 15.40%. The Financials sector saw a TFR median increase hardly move. LTI did increase 17.13%, but overall, there was a 0.85% decrease.
The Energy sector continues its strong growth, with TR having the second largest increase of 11.14%. This follows last year where it had the highest increase in TR by 18.33%. This again is primarily driven by growth in STI and LTI (the highest and second highest respectively).
Component changes
We proportioned the sample by CEOs that saw either an increase or decrease greater than 1% or a change within 1%. This is to see if there were significant changes in pay for the separate components.
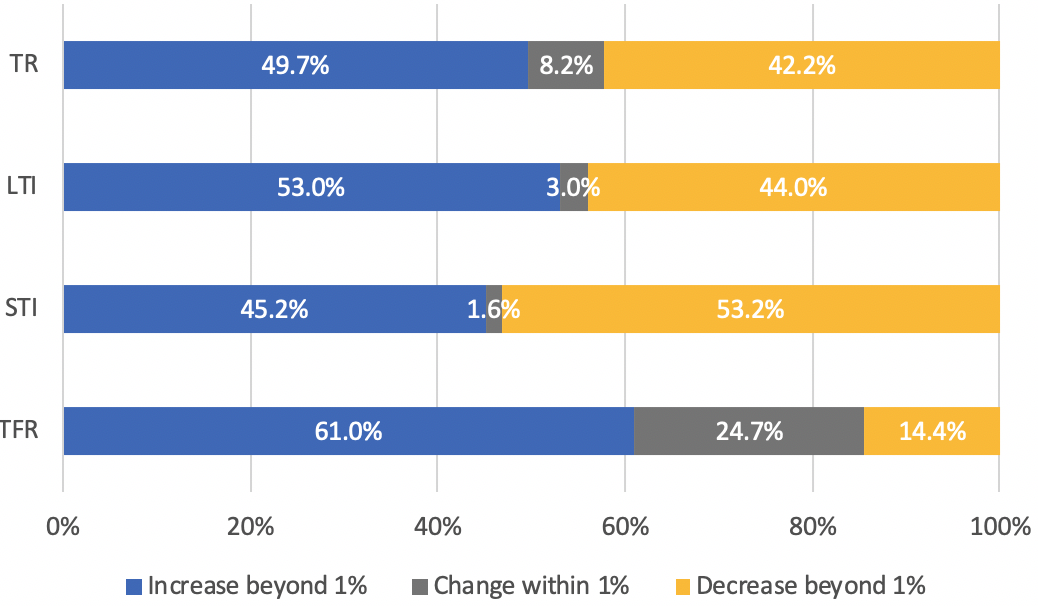
Figure 3: Changes by component of pay
Over half (61.0%) of the sample received an increase in fixed remuneration, while 24.7% saw a change within 1%. About 39% of the CEOs did not see their pay increase, similar to last year.
For STIs, 53.2% of the companies saw a decrease, compared to last year’s 42.9%.
The LTIs were more evenly split. Fifty-three per cent of CEOs experienced an increase in their LTI, down from last year’s 65.2%. Note that statutory LTI values are fair values based on accounting standards.
Overall, about 49.7% of the market saw an increase in their total remuneration, and about 42.2% saw a decrease.
Market averages
We attempted to eliminate outliers and biases resulting from large percentage changes on small monetary values. This was performed by using different weighted averages to view the changes in remuneration components.
The average remuneration changes were analysed in three ways:
- An incumbent weighted average where each individual’s change in remuneration elements is weighted equally.
- A total remuneration weighted average where the weights are the average incumbents’ 2 years of total remuneration over the sum of all 147 CEOs’ first year total remuneration. This method puts a higher weighting on individuals who receive higher overall remuneration.
- A remuneration component weighted average where the weights are the first incumbent remuneration component (TFR, STI or LTI) over the sum of all 147 CEOs’ first year amount for that remuneration component. This process is to see the impact of the remuneration components more clearly. (Note using the TR component here yields the same results as the total remuneration weighted average.)
Table 3: Full sample equally weighted incumbent changes.
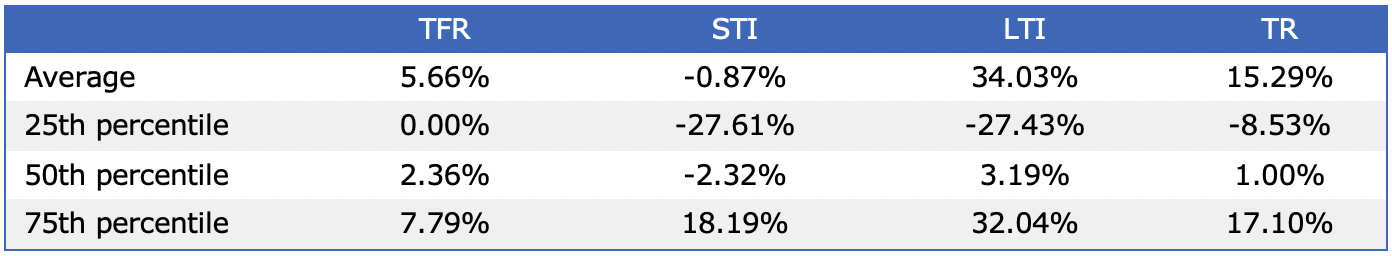
While the percentile rankings are indicative of the whole sample, the averages are skewed by large percentage changes on small amounts. The following figure illustrates this phenomenon.
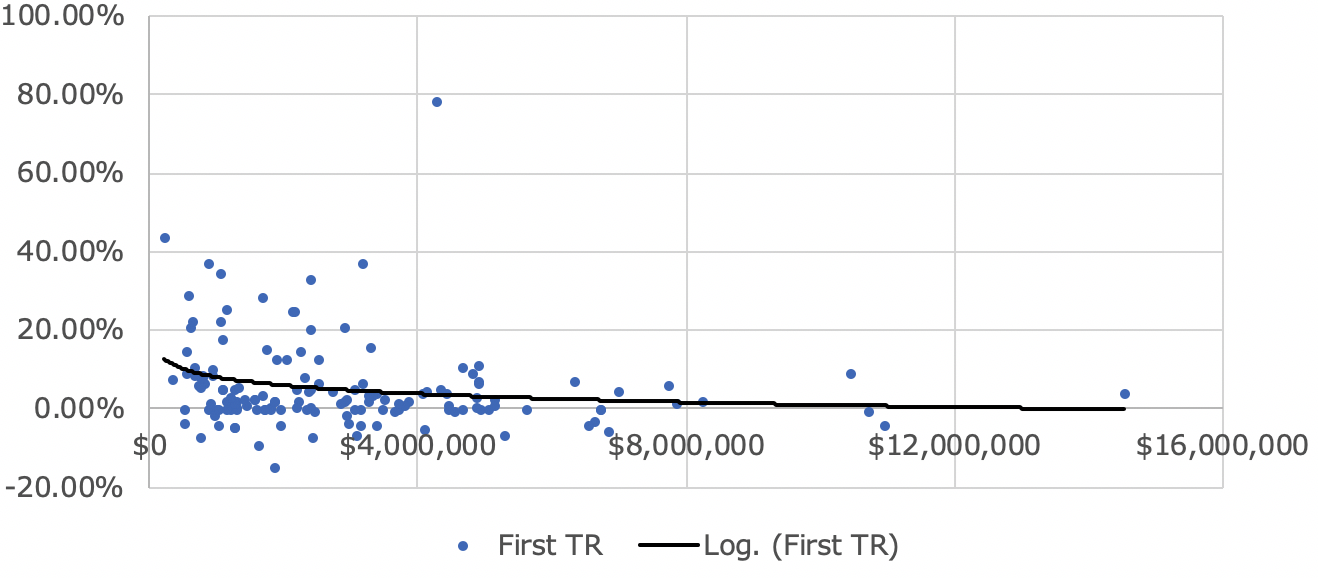
Figure 4: Percentage change in TFR by total remuneration in 2018
Figure 4 shows that lower paid CEOs are much more likely to experience high percentage changes in their remuneration. This is evidenced by the downward sloping logarithmic curve.
As such, the incumbent weighted approach is skewed by lower paid CEOs because they experience higher percentage changes. Therefore, using the average total remuneration as weights should provide a more valid figure of the overall market change. The total remuneration weighted average provides a measure of the overall change which is more robust to individual variability in levels of remuneration. This approach can be distorted as STI and LTI components are highly variable. Large one-off figures from performance incentives and revaluation of long-term equity grants will have a much larger influence within this measure compared to using a more robust figure such as total remuneration.
The remuneration component weighted averages provide a more valid depiction of the increases as it accounts for the different mixes of TFR, STI and LTI. This reflects the remuneration policies across companies with some companies paying high fixed remuneration at the expense of STI or LTI.
Table 4: Different weighted average percentage changes

The total remuneration weighted averages are less than the averages in the equally weighted figures across the board. This reinforces the findings of Figure 4, that higher paid CEOs had smaller proportional changes across all remuneration components than lower paid CEOs.
The remuneration component weighted averages provide a more valid depiction of the increases as it accounts for the different mixes of TFR, STI and LTI.
Using this approach, we see an average increase in fixed remuneration of 3.98%. STIs decreased by 7.56% and LTIs increased by 6.66%. This indicates that CEOs with high STI and LTI figures only saw a small increase in these components. TR increased by 4.14% (which is identical to the total remuneration-weighted average given the calculation approach is equivalent.)
Regression
Regression analysis was also conducted across a suite of company financials to determine whether a relationship between financials and pay exists. The regression which produced the most significant output was having TFR against market capitalisation, total assets and revenue. However, the small coefficients suggest that the effect is small. The figure below shows the relationship between total assets and TFR.
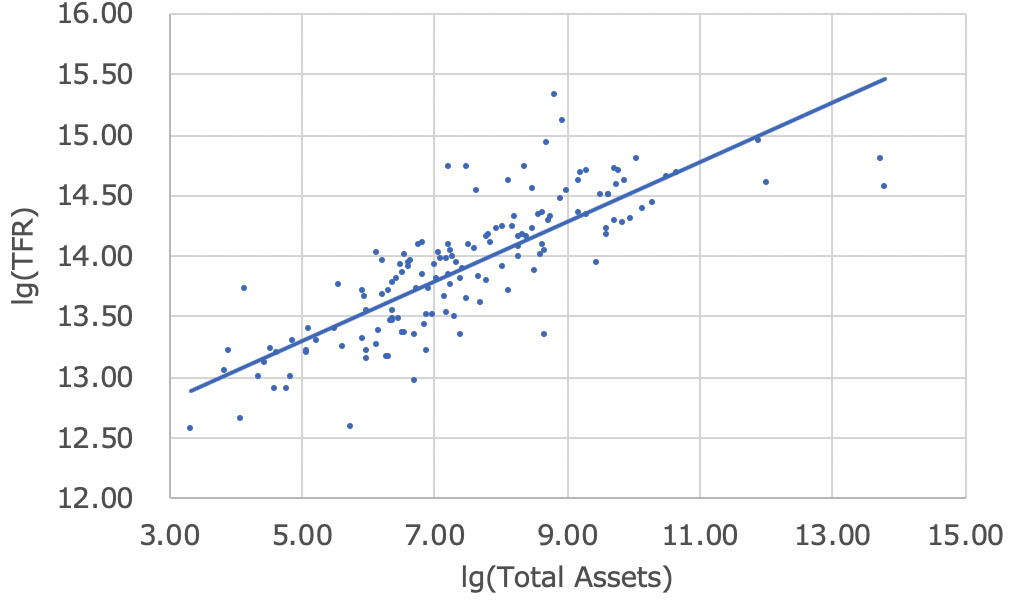
Figure 5: Regression of TFR against Total Assets
Regression analysis was also conducted using TSR and remuneration report votes against as independent variables. There was no significant relationship with any of the remuneration components.
Methodology notes:
The population of ASX300 listed companies was taken just after the September 2019 S&P ASX300 index rebalancing. Remuneration figures for the executives corresponding to these companies were subsequently obtained from GuerdonData®, a database of remuneration information sourced from the statutory disclosures present in company annual reports.
Companies with financial years ending in December or that are yet to disclose their 2019 annual reports at the time of analysis were removed from the sample. Similarly, companies that listed on the ASX during 2018 or 2019 were removed, since they have no remuneration disclosures available prior to their listing. Finally, companies which lacked statutory disclosures for other reasons were also removed.
Since our analysis spanned two reporting periods, it was required that the executives in question held their position for the entire two-year timeframe. Executives who changed position or served a part-year term were excluded from the analysis. Additionally, executives terminating at the end of the two reporting periods had their termination benefits removed to avoid skewing their remuneration amount.
Disclaimers:
The averages for the incumbent weighted changes are affected by outliers.
The segmenting of results into multiple sectors is limited as the small sample sizes introduces large variability in the observed values.
For the STI and LTI figures, large changes in incentive levels themselves adds to the year on year variability.
Some results may be reflective of data-mining effects rather than underlying causal factors, due to the limited sample size of 147.
The sample reduction itself is a source of bias. Relying on the ASX300 at a particular point in time excludes companies which have previously fallen out from the index and replacing them with recent additions. This may cause a positive bias if there is a correlation between share price performance and remuneration or market capitalisation and remuneration.
The following abbreviations have been used:
TFR: Total fixed remuneration including cash salary, fringe benefits and superannuation
STI: Short term incentives, which is pay contingent on performance measured within a 12-month period.
LTI: Long term incentives, which is pay contingent on performance over a period greater than 12 months (typically 3 or more years.)
TR: Total remuneration, which is the sum of the above
TSR: Total shareholder return
© Guerdon Associates 2026
 Back to all articles


