
 Subscribe to newsletter

NED fees ON THE RISE in 2019
09/03/2020


As is the case annually, it is time to review pay for chairmen and other non-executive directors (NEDs) in the ASX 300 for 2018 and 2019.
Overall
A total of 987 full year chairmen and other NEDs across 226 companies were used for the sample, taken from the statutory disclosures of companies in the ASX 300 between FY2018-2019.
The median increase in remuneration was 1.85% for chairmen and 2.50% for other NEDs.
This is higher than the increase between FY2017-2018 which was 1.45% for chairmen and 2.07% for other NEDs (see HERE) and is more aligned with the FY2016-2017 increases of 1.65% for chairmen and 2.92% for other NEDs (see HERE) .
Table 1 presents the change in fees, broken down into chairmen and other NEDs.
Table 1: Chairmen and other NED remuneration adjustments by position

The median percentage change in remuneration received by chairmen in FY2018-2019 was greater than FY2017-2018 by 0.4%. NEDs also fared better with the median percentage change in FY2018-2019 being 0.43% higher than FY2017-2018.
Table 2 shows a breakdown of the changes in NED total remuneration.
Table 2: Percentage of NEDs by change in remuneration

The percentage of chairmen who experienced an increase in remuneration increased slightly to 63.58% from 62.75% in FY2017-2018. Only 8.02% of chairmen experienced a decrease in remuneration, down from 16.34% in FY2017-2018. Remuneration remained unchanged for 28.4% of chairmen, which is up from 20.92% in FY2017-2018.
From Table 2, 67.15% of other NEDs experienced an increase, up from 60.95% in FY2017-2018. Slightly more other NEDs experienced no change with 21.58% compared to FY2017-2018 which saw 21.05% experiencing no change. Fewer other NEDs experienced a fee decrease with 11.27% which is down from 17.99% in FY2017-2018.
Not all boards adjust fees annually. They may wait 2 or sometimes 3 years before applying a large increase. Although the year-on-year increase may be large, the annualised increase over the number of years since their last increase needs to be considered.
Table 3 shows the summary statistics for the 66.57% of boards that increased their fees during FY2018-2019.
Table 3: Chairmen and other NED remuneration increases by position
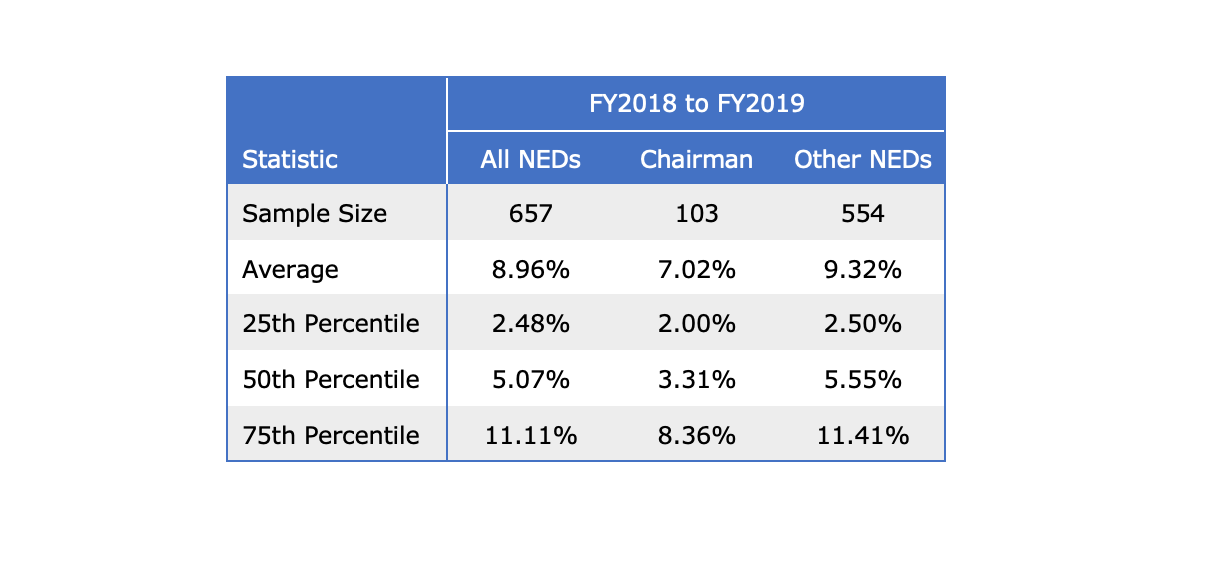
Figure 1 below presents the distribution of total remuneration for chairmen. It shows that the majority of chairmen tend to be paid between $100,000 to $300,000.
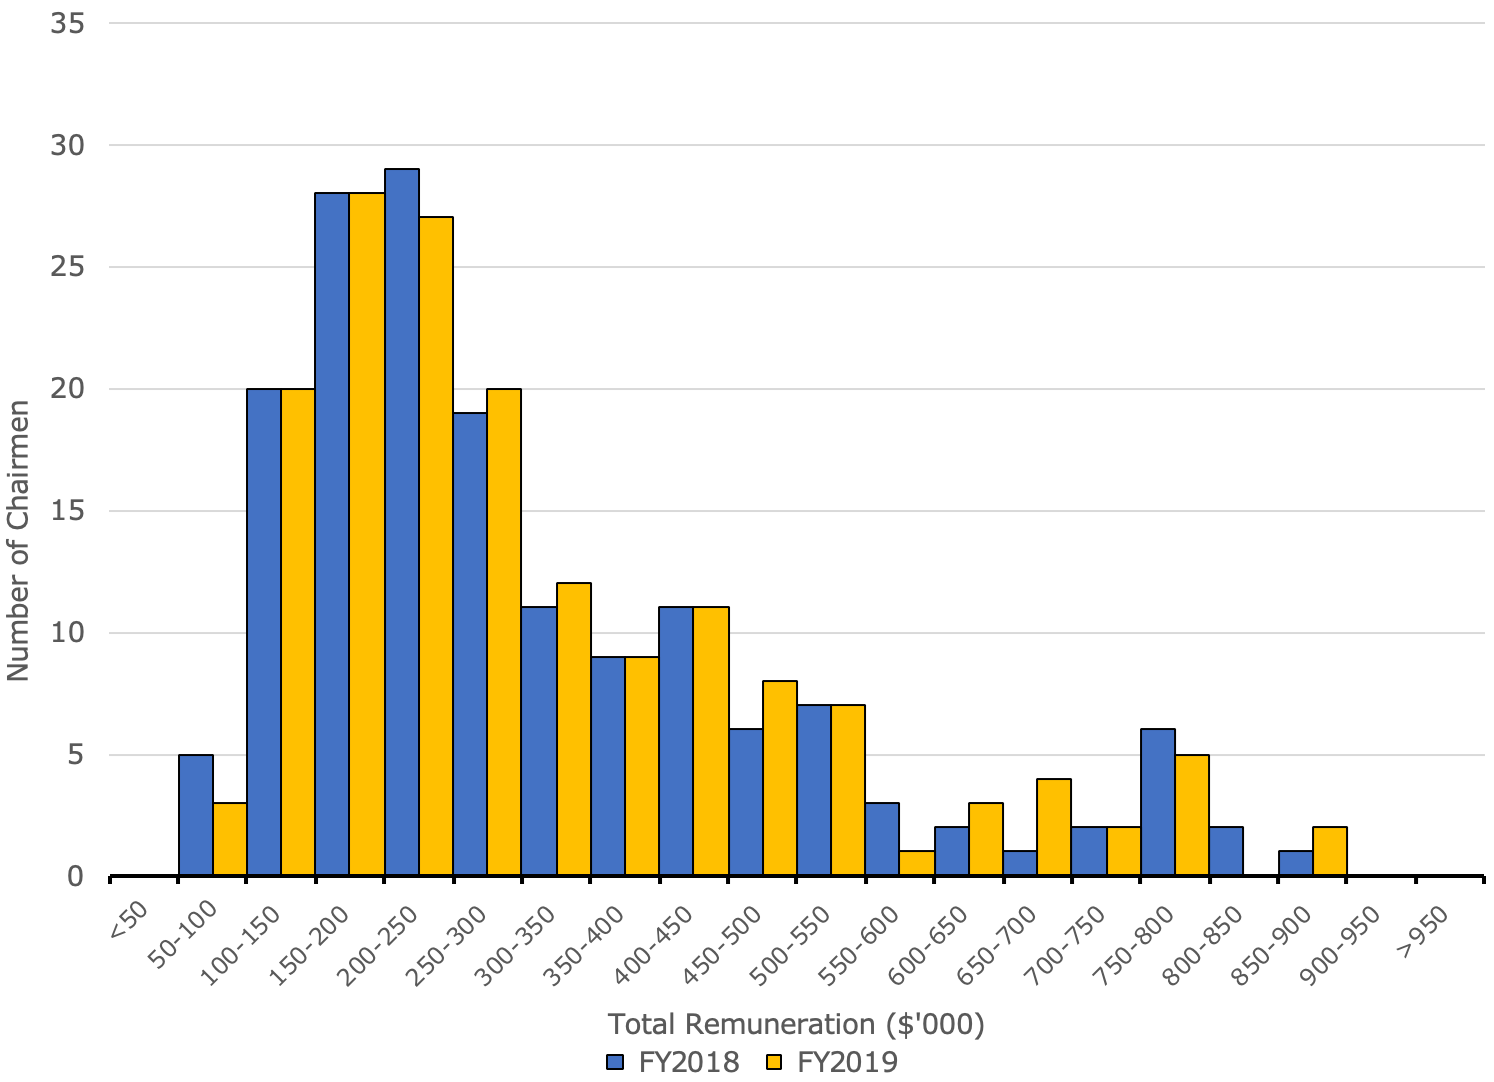
Figure 1: Comparison of yearly distribution of chairmen total remuneration
For FY2019, fewer chairmen were paid below $250,000 while more chairmen were paid above $250,000.
Figure 2 below presents the distribution of total remuneration for other NEDs. It shows that the majority of them tend to be paid between $50,000 to $250,000.
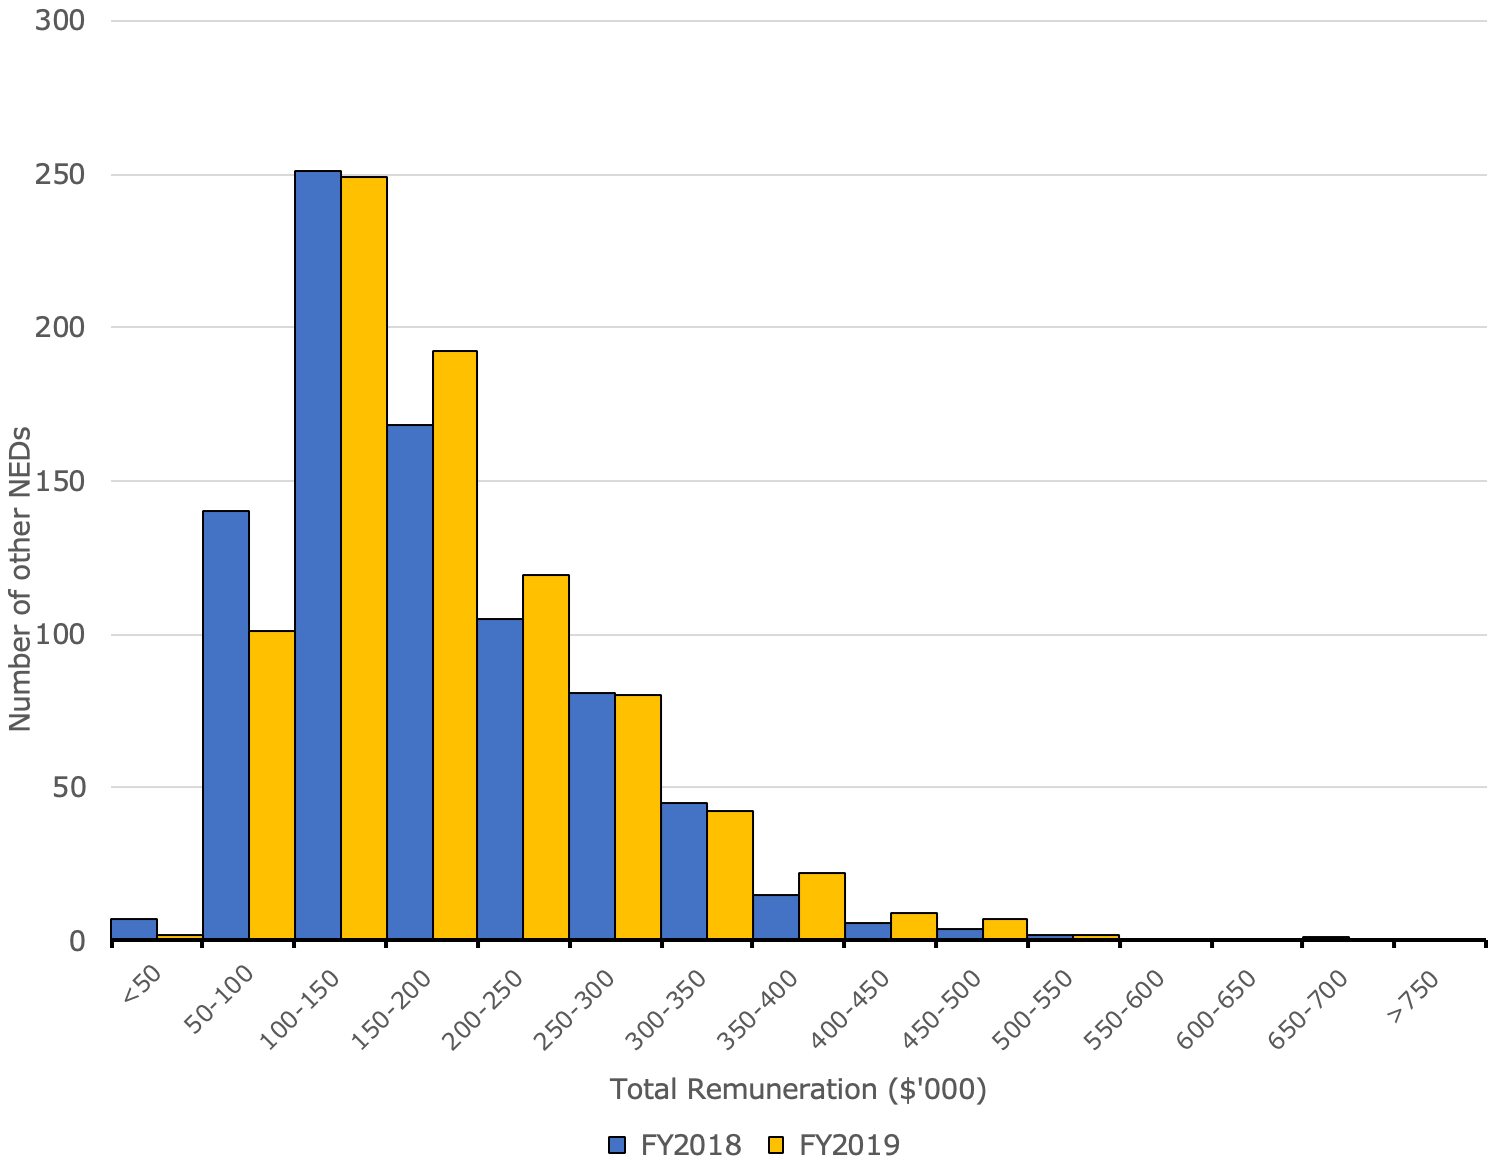
Figure 2: Comparison of yearly distribution of other NEDs total remuneration
For FY2019, fewer were paid below $150,000 while more were paid above $150,000.
For same incumbent chairmen and other NEDs, 77.81% receive superannuation while 5.88% have share-based payments. They do not all receive superannuation because of their remuneration agreements. Some are on terms where their remuneration payments are made to a separate entity. As such, there is no need to make contributions to the NED’s superannuation.
By Company Size
Chairmen and other NEDs’ total remuneration were divided into 4 groups based on the quartiles of the companies’ 30-day market capitalisation. The first, second and third quartiles were $751m, $1,885m and $5,600m.
Table 4 shows the change in remuneration based on these quartiles for chairmen.
Table 4: Chairmen median and average change in remuneration by company size
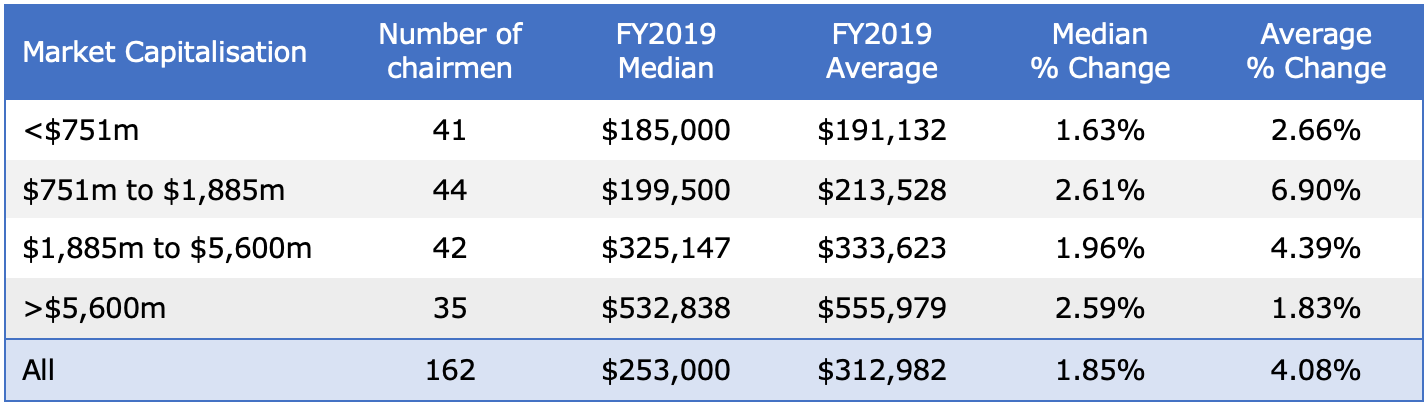
Chairmen within the second largest group by company size, between $751m and $1,885m market capitalisation for FY2018-2019, saw the largest change in median pay. These NEDs had a median increase of 2.61%.
The second largest median increase was for companies above $5,600m. They saw a median pay increase of 2.59%. The third largest group by company size, companies between $1,885m and $5,600m, experienced the third highest median pay increase of 1.96%.
Chairmen at the smallest companies fared worst. They had a median pay increase of just 1.63%.
Table 5 shows the change in remuneration based on the aforementioned quartiles for the other NEDs.
Table 5: Other NEDs’ median and average change in remuneration by company size
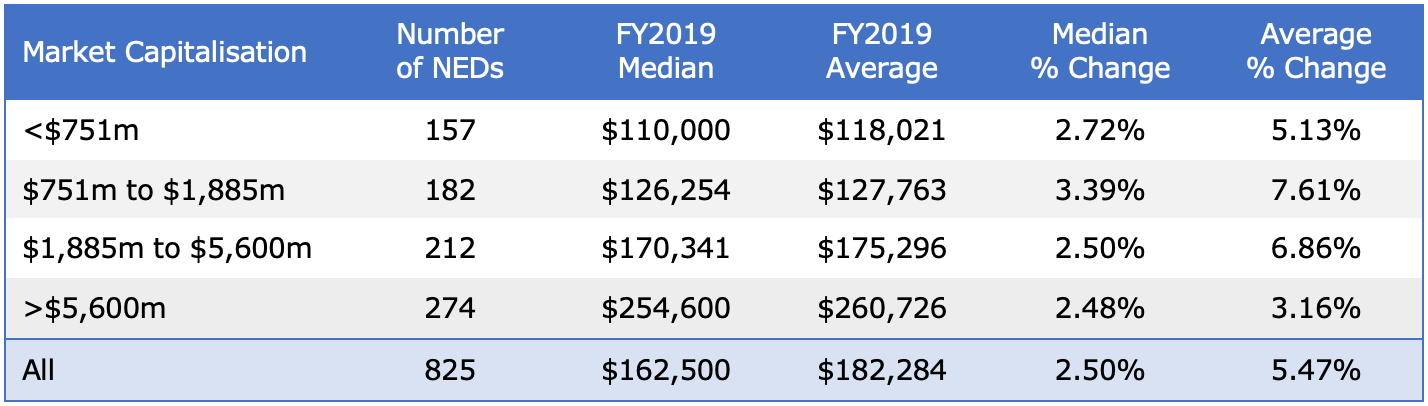
Similar to chairmen, the second largest group by company size experienced the highest increase in median pay for NEDs. These NEDs had a median pay increase of 3.39%.
The smallest group by company size experienced the second highest increase. These NEDs had a median pay increase of 2.72%. The third and fourth largest groups by company size saw increases of 2.5% and 2.48%, respectively.
For FY2018-2019, the proportional increase of NED fees was higher than the proportional increase of chairmen fees for all groups by company size, except the largest.
By Company Sector
Chairmen and other NEDs were divided into 11 groups based on their company GICS sector classification.
Table 6 shows the chairmen change in remuneration based on these GICS sectors.
Table 6: Chairmen median and average change in remuneration by GICS sector

Chairmen of companies in the Communication Services and Health Care sectors saw no median change in fees. Energy company chairmen saw the smallest median increase at 0.6%.
The one same incumbent chairman from the Utilities sector received the largest median increase at 4.88%.
The Communication Services sector experienced the second highest median percentage increase of 3.14%.
Table 7 shows the other NEDs change in remuneration based on GICS sectors.
Table 7: Other NEDs median and average change in remuneration by GICS sector
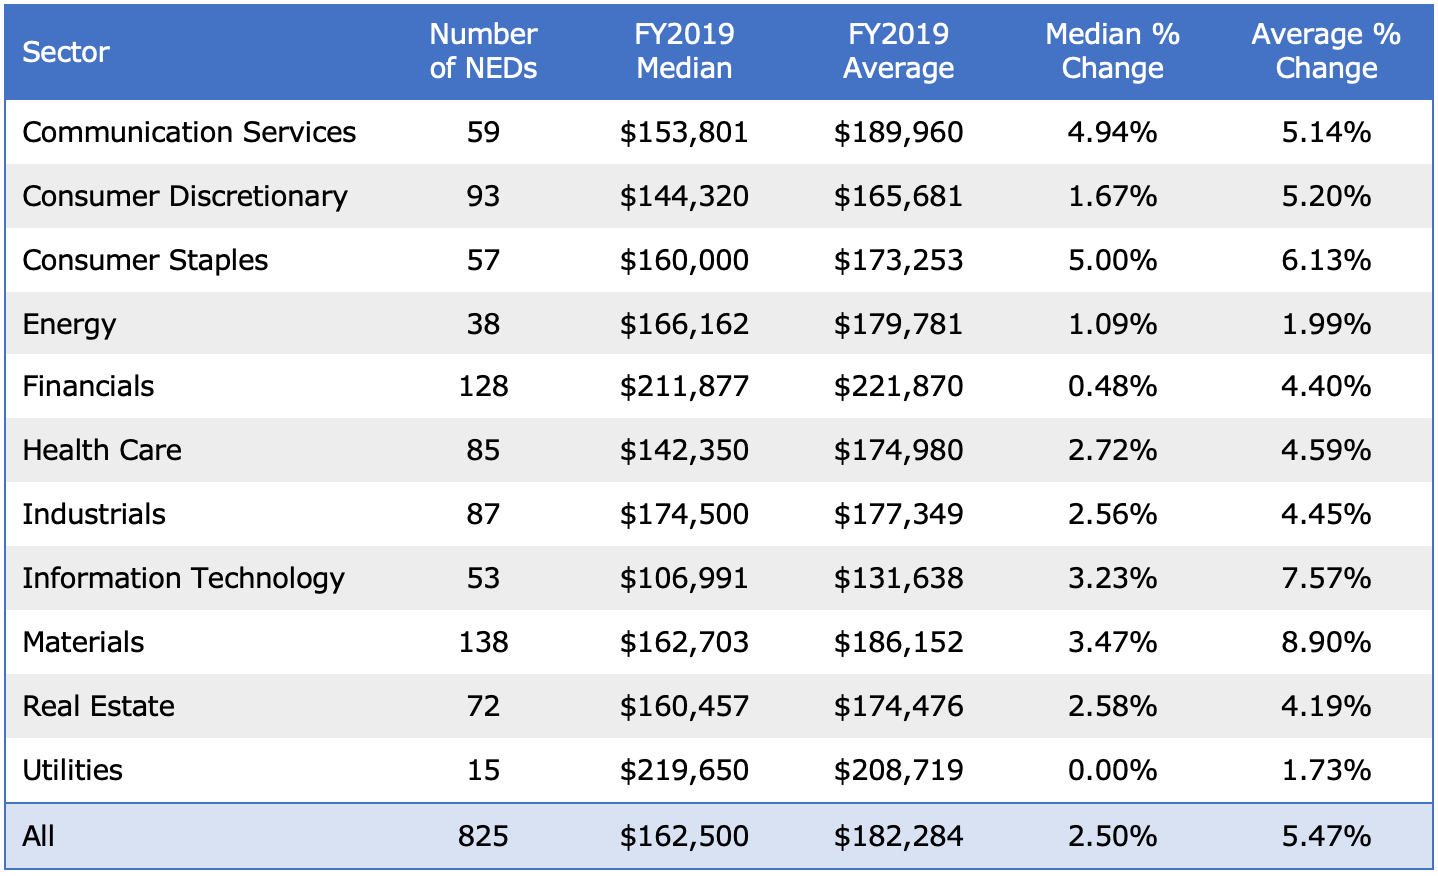
Utilities sector NEDs saw no median increase in fees while NEDs from companies in the Financials and Energy sectors saw median increases of 0.48% and 1.09% respectively.
The NEDs that experienced the highest pay increases were from the Consumer Staples, Communication Services and Materials sectors with median percentage increases of 5%, 4.94% and 3.47% respectively.
The low increases in both chairmen and NED fees for the Energy sector continues the trend of stagnation in this sector’s director total remuneration. The combined sample of chairmen and NEDs in the Energy sector also experienced the lowest median percentage change in both FY2016-2017 and FY2017-2018.
Methodology
The data was derived from GuerdonDataÒ, which is the proprietary database by Guerdon Associates for executive and director pay for all companies in the ASX300. (Available for client subscription, to try our demo product, click HERE .For enquiries regarding a subscription, please contact us on info@www.guerdonassociates.com).
Companies with financial years ending in December or that are yet to disclose their 2019 annual reports at the time of analysis were removed from the sample. Similarly, NEDs that changed position during the time of study were removed from the sample, as well as those who were not in their position for the full 2 years. Companies that were only added or removed from the ASX300 during the duration of the sample time period have also been removed from the study.
The market capitalisation of companies was taken on a 30-day average up to the 30 June 2019. Therefore, for companies that were delisted between the end of 2019 and this time period, we were able to take their market capitalisation from that time period.
Exchange rates for directors paid in a foreign currency was taken as the daily average for the respective exchange rate during the relevant financial year.
Calculations and percentages were made on each NED’s change in remuneration.
© Guerdon Associates 2026 Back to all articles


