
 Subscribe to newsletter

ASX 300 CEO median total remuneration declined in 2020
08/02/2021


It is time for Guerdon Associates’ annual review of pay increases for Chief Executive Officers (CEOs) and Managing Directors (MDs) who led ASX 300 companies in the past 2 reporting periods.
Summary
The sample consists of 164 ASX 300 CEOs who served two full years over the FY 2020 reporting period. Remuneration data was sourced from GuerdonData®, and total shareholder return (TSR) was sourced from Bloomberg®.
The median CEO total remuneration (TR) decreased by 2.3%. This can be largely attributed to the sharp decline of 17.1% in short-term incentives (STIs).
ASX 300 CEO fixed remuneration increases were less than increases for the general population. The Australian Bureau of Statistics Wage Price Index rose by 1.4% over the year to September 2020, whereas the median increase in CEO total fixed remuneration (TFR) was 0.3% over the 2020 financial year.
Of the 164 CEOs, 48% received an increase in fixed pay and 25% did not see any movements in fixed pay. Overall, 42% of the CEOs saw an increase in their total remuneration (TR) and 53% saw a decrease in TR.
In past analyses, pay movements lagged TSR outcomes. This year, both TSR and TR decreased, with a median TSR outcome of -7.0% and median decrease in TR of 2.3%. A comparison of company TSR and TFR movements shows the majority of CEOs who had a decline in TFR were from companies which saw a decline in market capitalisation. However, the inverse is not true, and some CEOs saw an increase in TFR despite the drop in market capitalisation.
Longitudinal trends
While the median increase in ASX 300 CEO total remuneration has been trending downwards over the last three years, this year saw a decline in pay with more than half the CEOs experiencing a decrease of more than 2.3%.

Figure 1: Total remuneration median changes since 2013
Total remuneration (TR) is the sum of total fixed remuneration (TFR), short-term incentives (STI) and long-term incentives (LTI).
Both STI and LTI reflect statutory disclosures, which includes the amortised value of deferred compensation and share-based payments expense when incentives are delivered as equity instruments.
The table below shows the median year-on-year change in each remuneration component over the last 3 years, see HERE for 2018-2019 and HERE for 2017-2018.
Table 1: Median change in ASX 300 CEO remuneration
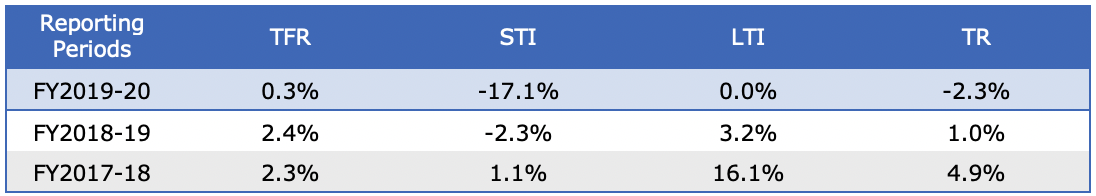
FY2019-20 saw a median increase in TFR by 0.3%, a significant change from the median increase of 2.3% to 2.4% over the prior 2 years.
The overall decrease can largely be attributed to the disruption of COVID-19. Temporary TFR reductions, the cancellation of FY20 STIs and the reduced likelihood of vesting for on-foot LTIs have all played a part in the reduction of TR. See HERE.
Figure 2 shows the average and quartiles of the dollar value of each CEO remuneration component.

Figure 2: Distribution of ASX 300 CEO remuneration by remuneration component
The average and interquartile range of TFR remained unchanged. STI decreased across the board in both average and quartiles. The average, 25th percentile and median (50th percentile) for LTI and TR have remained the same while the 75th percentile decreased.
Component changes
The graph below shows the proportion of CEOs that saw a year-on-year increase or decrease in each remuneration component by more than 1%, or a change within 1%.
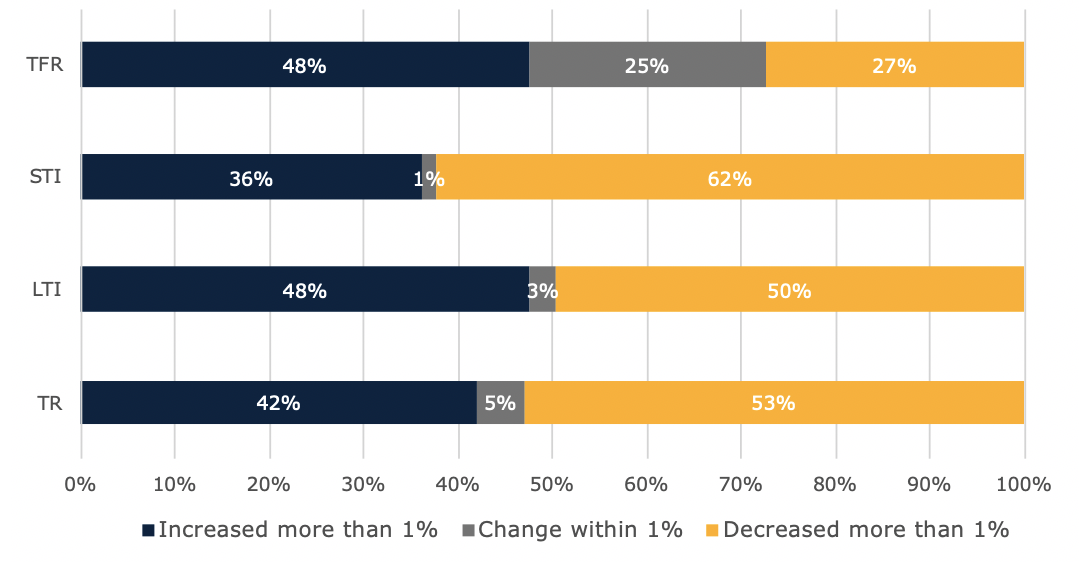
Figure 3: Changes by component of pay
Almost half (48%) of the sample experienced an increase in TFR, while 25% saw a change within 1%. The 27% of CEOs who experienced a decrease in TFR is nearly double the 14% in the prior year.
The majority of CEOs saw a decrease in STI. The proportion of CEOs with STI decreasing has moved from 53% last year to 62% this year. The movements in LTIs were more evenly split. Half the CEOs experienced a decrease in their LTI, up from last year’s 44%.
Overall, 42% of the CEOs saw an increase in their total remuneration, which is down from 50% last year. Fifty-three percent saw a decrease, which is up from the 42% last year.
By Company Size
The table below shows the median change in remuneration and TSR based on 30-day market capitalisation quartiles, as at the 30th September 2020.
Table 2: Median % change in remuneration and TSR by market capitalisation quartiles.
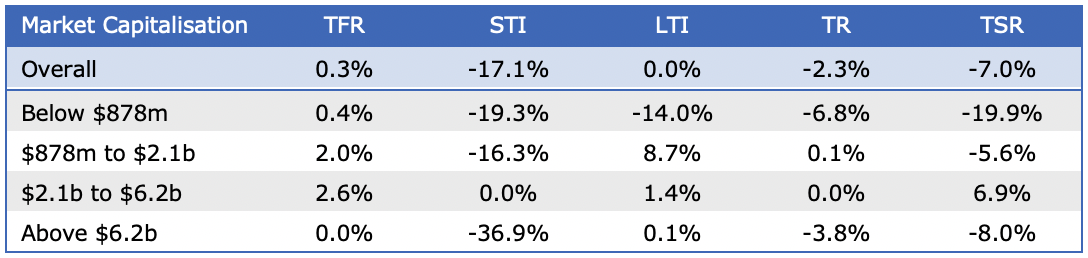
The middle 50% sized company CEOs saw a median increase in TFR of 2% or more, consistent with prior years. The largest company CEOs saw the biggest decrease in STI by 36.9% and no change in TFR or LTI.
By Sector
The table below shows the median change in remuneration and TSR across the different sectors.
Table 3: ASX 300 GICS sector breakdown of median TSR and change in CEO pay
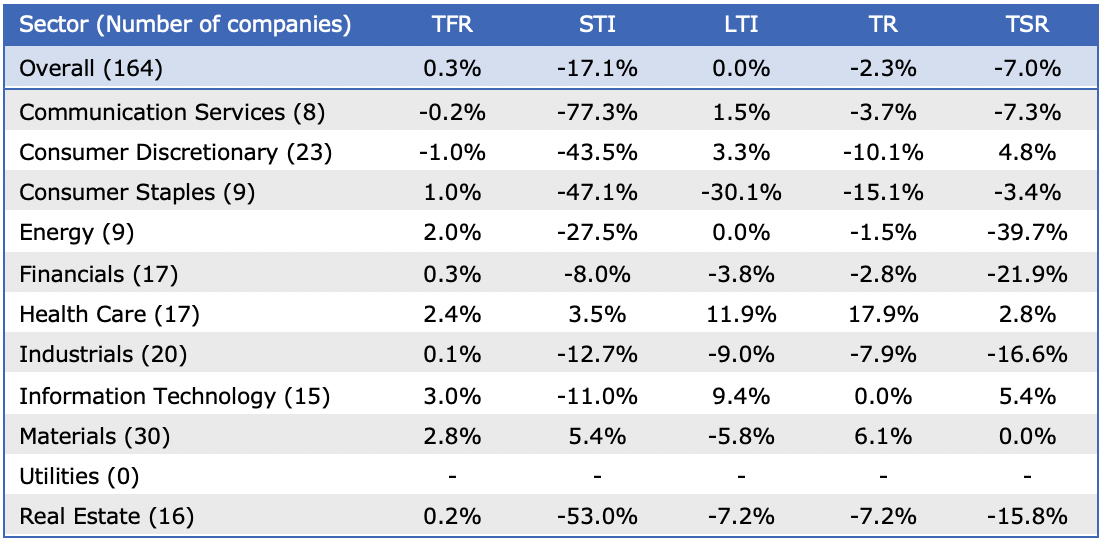
The sector breakdown shows the disproportionate effect of COVID-19 on each industry.
The Information Technology sector received the highest median growth in TFR with an increase of 3.0%. However, this is offset by the decrease in STI resulting in no change in TR for the median IT company.
The Health Care sector received the highest growth in median total remuneration with an increase of 17.9%. The increase was largely driven by an increase in LTI.
The Energy sector saw the biggest decrease in TSR due to oil price movements. Despite this, they experienced the fourth highest change in TFR and TR.
The figure below shows ASX 300 company TSR relative to the CEO change in fixed pay, by sector.
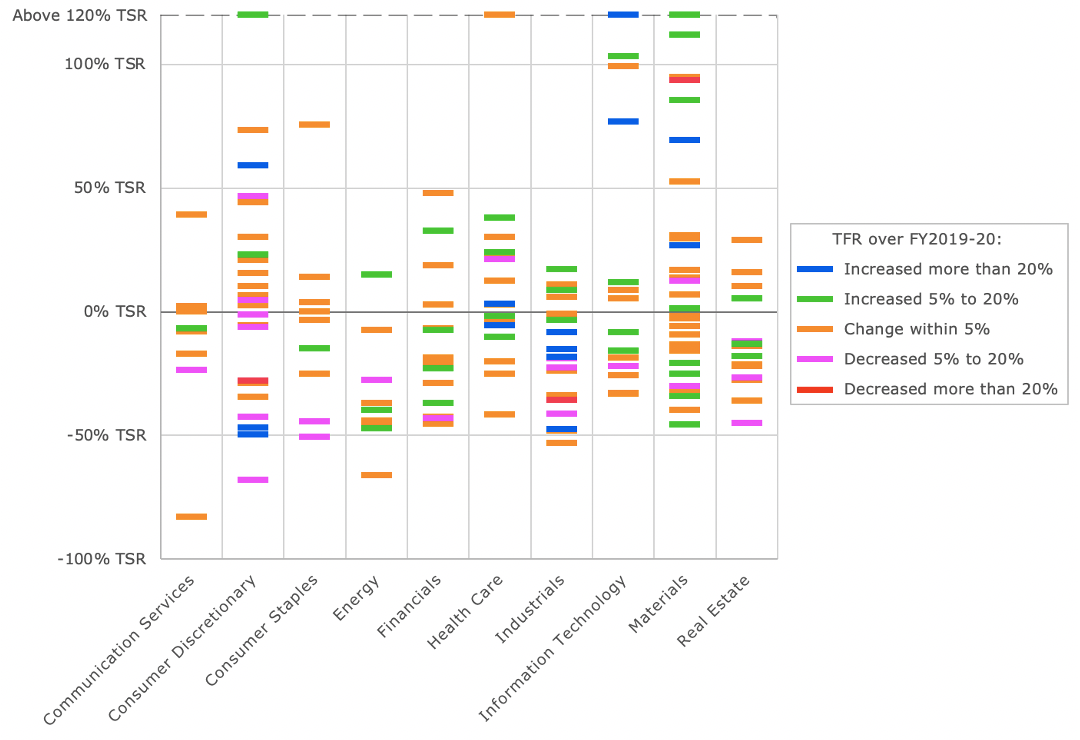
Figure 4: ASX 300 GICS sector breakdown of TSR and change in CEO TFR
The graph shows that decreases in CEO TFR over the year were typically by companies which saw a decline in market capitalisation. However, the inverse is not true, and some CEOs saw an increase in TFR despite the drop in market capitalisation.
Market averages
To reduce the effect of spurious outliers on the average, the data set is truncated at the 5th percentile and 95th percentile for each remuneration component. The table below shows the average and quartiles.
Table 4: ASX 300 CEO change in remuneration average and quartiles
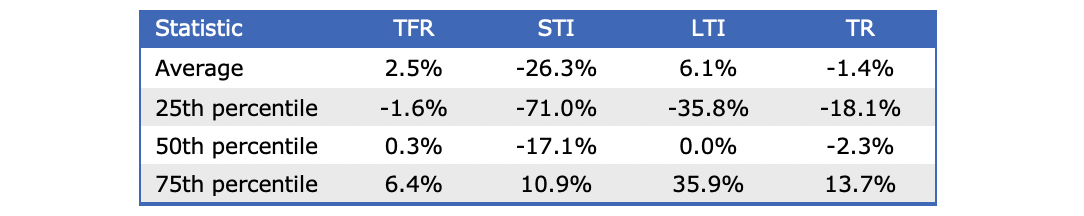
A simple average across the ASX 300 CEOs weighs each incumbent equally. This approach does not provide an accurate indication of the overall market as it is skewed by lower paid CEOs in the sample who experience highly volatile percentage changes in pay due to:
- Greater growth prospects and re-adjustment of pay to reflect growth in company size and scope
- Significant changes in remuneration outcomes as companies entering the ASX 300 are subject to greater investor scrutiny
Two weighted average remuneration changes were also analysed:
1. A total remuneration weighted average, where changes in pay are weighted by the dollar value of the average total remuneration for each CEO. This method puts a higher weighting on incumbents who receive higher overall remuneration.
2. A remuneration component weighted average, where changes in pay are weighted by the dollar value of each remuneration component (TFR, STI or LTI) for each CEO. This method puts a higher weighting on incumbents who receive a higher dollar value for each remuneration component.
The remuneration component weighted averages provide a more valid depiction of changes in each component as it accounts for the different incentive leverage of CEOs. This reflects the remuneration policies across companies with some companies paying high fixed remuneration and lower STI or LTI opportunity.
Table 5: Different weighted average percentage changes.
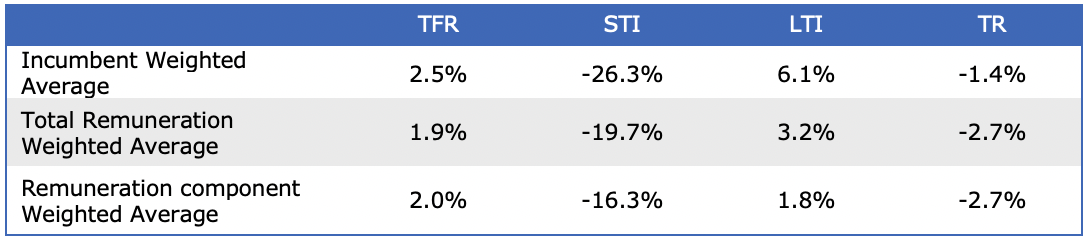
The total remuneration weighted averages indicates a greater decline in overall ASX 300 CEO total remuneration.
Methodology
The ASX 300 incumbents were taken after the September 2020 index rebalancing. Remuneration figures for the CEOs were obtained from GuerdonData®, a database of remuneration information sourced from the statutory disclosures present in company annual reports.
Companies that have not disclosed their 2020 annual reports at the time of analysis were removed from the sample. Companies that floated on the ASX in 2019 or 2020 were removed, since they have no remuneration disclosures available prior to their listing. Externally managed entities and companies incorporated outside of Australia which do disclose remuneration in accord with Australian accounting standards were also removed.
CEOs who changed position over the 2019-2020 period or served a part-year term were excluded from the analysis. Termination benefits were removed from CEOs leaving at the end of the two reporting periods.
Quartiles are calculated on the full sample of CEOs. To reduce the effect of spurious outliers on the average, the data set is truncated at the 5th percentile and 95th percentile for each remuneration component.
Disclaimers:
The segmenting of results into multiple sectors introduces large variability in the observed values due to small sample sizes.
Some results may be reflective of data-mining effects rather than underlying causal factors, due to the limited sample size of 164.
The selection criteria introduces sampling bias as the ASX 300 at a particular point in time excludes companies which have previously fallen out from the index and replacing them with recent additions. This may cause a positive bias if there is a correlation between share price performance and remuneration or market capitalisation and remuneration.
The following abbreviations have been used:
- TFR: Total Fixed Remuneration including cash salary, fringe benefits and superannuation
- STI: Short Term Incentives, which is pay contingent on performance measured within a 12-month period.
- LTI: Long Term Incentives, which is pay contingent on performance over a period greater than 12 months (typically 3 or more years.)
- TR: Total Remuneration, which is the sum of TFR, Total STI and LTI
- TSR: Total Shareholder Return
 Back to all articles


