07/09/2020
Guerdon Associates are continually analysing Long Term Incentive (LTI) vesting outcomes to determine the likelihood that an executive LTI will vest. This may become more important as, due to the uncertain times we are living through, companies consider replacing traditional LTIs with restricted share grants of equivalent value that vest with time. These structures typically have longer vesting periods, but no explicit performance hurdles.
So, while we can do the math for a particular company to estimate probable LTI vesting, we know some investors and proxy advisers may take a broad brush and expect discounts based on vesting outcomes across the entire market.
Some investors and proxy advisers believe that a 50% minimum discount should apply to the face value of an LTI grant before they will consider the alternative of a fixed equity grant that vests on the basis of time only.
This belief is not, on the basis of the following analysis, supported by the evidence.
Our research and analysis examined the vesting outcomes for LTI plans with performance periods ending between FY17 and FY19 for the current ASX 200. We have broken down the analysis by year, Global Industry Classification Standard (GICS) industry and the different groupings of performance measures:
- market and non-market conditions,
- Relative total shareholder return (TSR) and absolute TSR; and
- Financial and non-financial metrics.
All vesting outcomes were taken as the final actual outcomes. This means any adjustments as a result of the board exercising its discretion are included. All vesting calculations are taken as a percentage of maximum LTI opportunities. Any retested outcomes have been ignored as they skew the data.
Over the 3 years, 82% of the companies with an LTI plan had a market measure (e.g. TSR) while 70% had a non-market measure (e.g. EPS growth).
Of the companies with a market measure, 91% had a relative TSR measure while 16% had an absolute TSR measure. The overlap shows some companies have both relative TSR and absolute TSR in the LTI. There is also a strong bias towards relative TSR, reflecting the preferences of many investors and one influential proxy adviser, perhaps in the mistaken belief that such measures are less likely to be gamed (see HERE).
Ninety-two percent of the companies with non-market measures had at least one financial metric while 21% had at least one non-financial metric. The application of financial metrics in LTIs is probably no less valid than the application of TSR measures, with recent Guerdon Associates research suggesting that one of the common measures is robust and not gamed (see HERE).
Thirty percent of the companies in the sample had market measures only while 18% had non-market measures only.
Re-testing measures to encourage improvement in results over successive years is not supported by all proxy advisers (for example, see HERE) and most investors. Retesting has not been included in the analysis as it neither contributes any additional value nor is significant in terms of the final outcome.
Table 1: ASX 200 vesting results
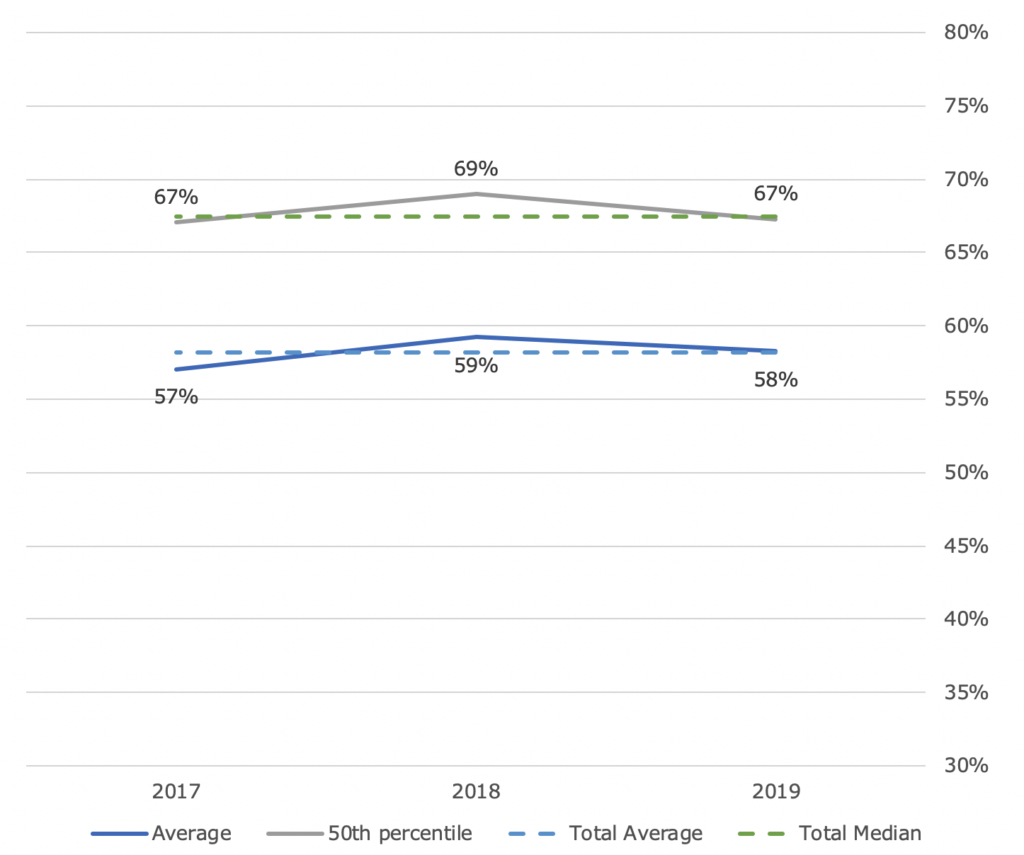
The analysis of vesting outcomes over the past three years indicates there is no increasing or decreasing trend in the amount of LTI that vests each year. The vesting outcome appears to be consistent over time. This can be seen in the figure below.
Figure 1: Amount of LTI vesting over time
The figure above shows that over the past 3 financial years, the average and median vesting of LTI plans have been consistent and not subject to much fluctuation.
Hence, the view of some investors and proxy advisers that a 50% minimum discount should apply to the face value of an LTI grant before they will consider the alternative of a fixed equity grant that vests on the basis of time only is not, on the above basis, supported by the evidence.
© Guerdon Associates 2024 Back to all articles


 Subscribe to newsletter


